by Alan Montgomery
Mathematician
218 McCurdy Drive, Kanata, Ontario K2L 2L6 Canada
and
Lambert Dolphin
Physicist
1103 Pomeroy Avenue, Santa Clara, CA 95051
ABSTRACT
The possibility that the velocity of light, c, is not a fixed constant is reconsidered by statistical analysis of the historical measurements collected from four sources. Our hypothesis testing of the selected data shows the measured value of the velocity of light has decreased over the past 250 years. Furthermore, the probability of some systematic or experimental problem was found to be low. Brief analysis of constants other than c suggests that those constants which involve atomic phenomena and units of time are also apparently changing. A third set of constants with no obvious dependence on c were analyzed and show no apparent variability with time. A variable velocity of light implies that atomic clocks and dynamical clocks do not run in step---that atomic time has been decreasing with respect to dynamical time.
BACKGROUND
From the times of the ancient Greek philosophers until Galileo light transmission was regarded as instantaneous---that is, the velocity of light, c, was assumed to be infinite. Although some scientists held contrary views these were in the minority. Galileo attempted the first measurement of c around 1638 by means of lanterns equipped with shutters over a baseline of the order of a mile. Though unsuccessful for obvious reasons, the scientific community finally considered the possibility that c was finite. The Danish astronomer Olaf Roemer in 1676 announced that he had measured a time delay in the eclipses of Jupiter's moon Io which he ascribed to transit time of light over the diameter of the earth's orbit. He suggested this was proof that c was finite. Unfortunately, Descartes and others were unconvinced and it was not until 1729 that the English astronomer Bradley proved Roemer correct by measuring the aberration angle of several stars. After two centuries of measuring c, a French astronomer, Gheury de Bray claimed in 1931 that the various measurements of c formed a trend (Ref. 1). This hypothesis remained controversial during the 1930's. By about 1940 Birge and Dorsey had swayed most against it. In the post war era new and substantially different data emerged and the pre-war values were generally ignored. By 1983 the velocity of light was defined as a constant at 299792.458 km/sec.
The controversy might have been forgotten entirely had it not been for Thomas Van Flandern of the National Bureau of Standards who noticed a slight deviation of the orbital period of the moon between 1955 and 1981 as measured by atomic clocks (Ref. 2). He concluded "...if this result has any generality to it, this means that atomic phenomena are slowing down with respect to dynamic phenomena...though we cannot tell whether the changes are occurring at the atomic or dynamic level." In 1987 Trevor Norman and Barry Setterfield pointed out the de Bray and Van Flandern hypotheses were equivalent if the change in c were due to a change in electromagnetic frequencies as measured by dynamic clocks. They proceeded to analyze the measurements of c and other atomic constants and concluded that this was indeed so. (Ref. 3)
The data assembled for this study came from four sources: Birge (Ref. 4, Dorsey (Ref. 5), Froome & Essen (Ref. 6) and Norman & Setterfield (Ref 3). Norman & Setterfield concluded that the velocity of light when measured by dynamic (gravitational) time standards showed a systematic decrease. Their claim is supported by the results of many of their statistical tests but some negative results were omitted in their report and some of their data points appear to us to be questionable. The data they selected in their Table 11 (best 57 values) unquestionably supports the thesis that the velocity of light is decreasing but their selection procedure appears subjective and their efforts to identify other possible sources for the apparent trend are weak.
Our purpose in writing this paper is to catalogue as much relevant data as possible, to select a subset of the most appropriate data, and to analyze the selected data with a view to confirming or denying the decreasing c (Setterfield) hypothesis.
SELECTION OF DATA
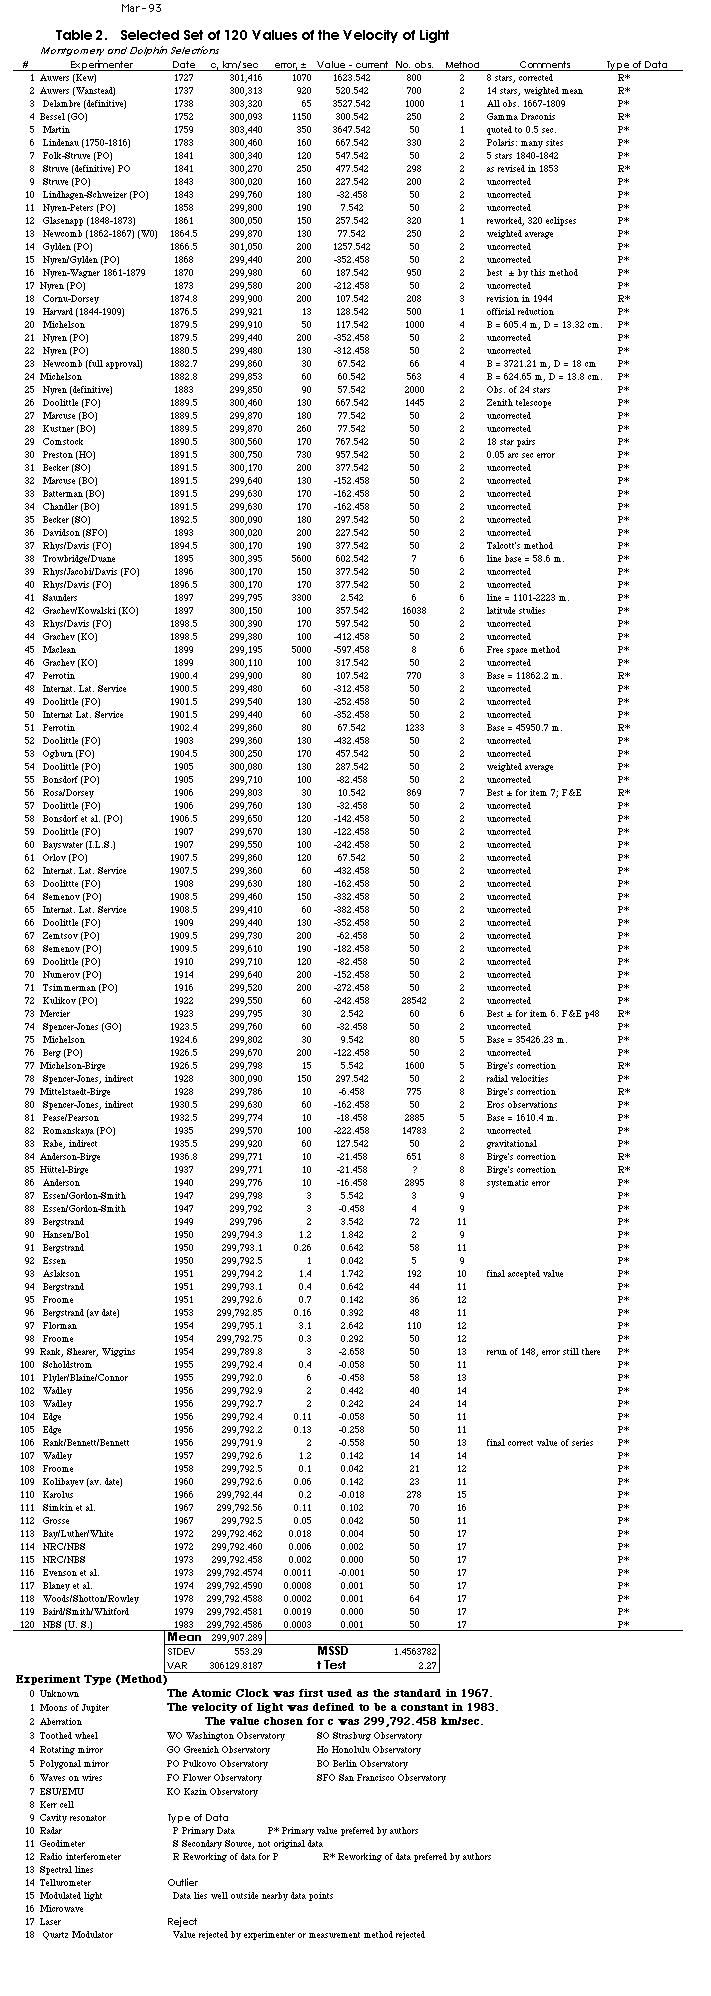
Our basic approach has been to include the maximum number of legitimate experimental measurements of c (by recognized measurement methods) in order to maximize the credibility of the statistics while minimizing any distortions due to poor data points. Our combined master data set, Table 1, compiled from the above-mentioned sources yielded 193 data points. To be excluded from this master set are values of c for which the original observations are missing or unknown, duplicate values from various reworked observations, dubious values from the earliest measurements of a given method where technique was still poor, values from poor methods, and outliers.
In compiling our selected list of c measurements, Table 2, we kept data even if there was some doubt about the availability of original observations at the time. When measurements by a given experimenter were reworked for the purpose of adjusting for some known defect we selected the reworked values. When reworkings were merely statistical we selected the value most compatible with the values of surrounding data. We then excluded data in cases where the experimenter himself or his peer group was critical of the credibility of the results---especially on initial data of a method or when the experiment was redone by the original experimenter within a short period of time. These data were of lower precision. Measurements of c by certain methods were excluded when accuracy and consistency of data were poor. Since the accuracy and precision of the data varied greatly, outliers were determined from piecewise analysis of 18th century, l9th century, pre-1945 and post-1945 data.
We also felt it necessary to include in our subset three Bradley stellar aberration values in the 1727-1757 era, as different stars or different observatories were involved in the listed data. We excluded the EMU/ESU method of measuring c although we did keep the Rosa/Dorsey datum as it alone seemed to have received general acceptance. We felt at first that the standing wire results should be treated the same way, but after adjusting the values to in vacuo we concluded the average accuracy did not warrant their exclusion. The radar data also posed a special problem. Three data points could not be converted to in vacuo because the conversion factor is affected significantly by water vapor which was not measured. The range of the conversion factor and the accuracy of the data were such that tests were ambivalent over the possible range of the conversion factor. The fourth radar value of c had a systematic error.
As a result of our deselection process, 4 data points were rejected as secondary values, as well as 28 duplicates (reworked), 9 poor initial values (rejected by the experimenter), 26 points due to unacceptable methods (rejected method) and 5 as outliers. (The starred values in Table 1 are the values we selected into Table 2). The deleted data were also analyzed as a check on our procedures. In all, 120 of 193 original data points were selected. The selected list includes about 75% of Setterfield's data and twice as many points as his best 57 values of c.
Finally, the laser method values of c were obtained using atomic clocks as a time standard. These values do not come under the proposed hypothesis since the atomic clock's time would change uniformly with a change in c. They were omitted from our tests unless explicitly stated, although they have not been deleted in compiling Table 2.
METHODOLOGY
The basic technique we used to analyze Table 2, the selected data, is the standard statistical hypothesis testing. Four statistical testing methods were used in this paper. These are: the Student t, the binomial (which is here assumed to be distributed approximately Normal), the run and the mean square successive difference (MSSD). For the Student t statistic, the null hypothesis is that c is constant at 299792.458 km/sec. For the binomial test, the null hypothesis is that the distribution of values is random about 299792.458 km/sec, and for the run and MSSD tests, constancy as opposed to trend over time. The run test quantifies the tendency for data higher (or lower) than the mean to cluster in sequences called runs [the median can also be chosen as a central value]. The MSSD measures the serial correlation of the residuals with time and the MSSD is very similar to the Durban-Watson test for autocorrelation, (Refs. 7-9). The run and MSSD tests require ordered data. Where two or more data points had the same year we averaged them by weighting their values by the inverse of their error bars.
The run and MSSD directly test for trend. These tests are of primary importance in examining the credibility of the hypothesis of changing c. The t-test and the binomial tests are tests of the currently accepted value and may or may not provide evidence of a trend. It is also important to note that the MSSD is a parametric test using actual values but the run tests is non-parametric using only the position of the data. Because of this, the run test needs more data to be credible. Many of the cells in our analysis were too small for the run test to be done. After these four tests were applied to the data as a whole, the data was analyzed by time frame, by accuracy, by method and by error bar size to test the validity the overall results.
ANALYSIS OF SELECTED DATA SET
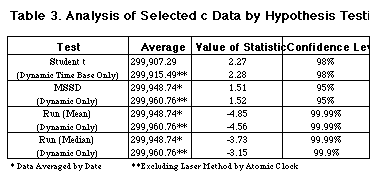
The overall results of the testing of the Setterfield hypothesis (that c is not a fixed constant), by Student t, run and mean square successive difference tests are shown in Table 3.
All test results exceed the 95% confidence level (i. e., there is less than a 5% chance of obtaining this statistic from a truly random distribution). The run statistics are higher than their counter-parts due partly to the large number of negative residuals in the post-1954 era. The high precision and accuracy of this data tends to inflate the size of the last run and its confidence level. However, if the final run is omitted the confidence level is still 99%. These results indicate a high probability of a decreasing trend in the measurements of the velocity of light.
Before these results can be accepted as support for the Setterfield hypothesis several questions must be answered:
We then analyzed the distribution of aberration and non-aberration data around the accepted value of 299,792.458 km per sec by 100 km/sec bands. The resulting distribution was tested by the binomial statistic and the results are shown in Table 5.
Results for all data were skewed towards the higher c values but only the 100 km/sec and the over-500 km/sec bands were significant. The stellar aberration method contributed more than half the selected values and had a substantial impact on the results, especially the 200 to 500 km/sec range. The non-aberration binomial statistics were beyond the 99.8% confidence level in all bands while the corresponding values for aberration values were between 5% and 50%. More importantly, the distribution of aberration values by time shows that 26 of 35 pre-1900 values are high while 29 of 33 post-1900 values are low. This confirmed to us that the aberration measurements of c are decreasing as in the whole set, but that its values are distributed in a lower range, i.e., they are systematically low.
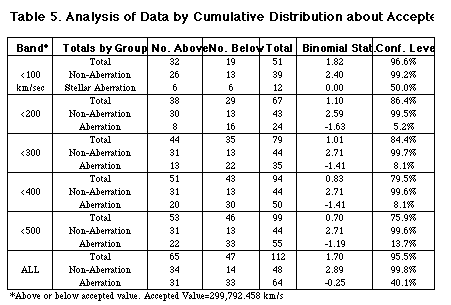
Is there any physical reason why the aberration values should be systematically low? Setterfield informed us that all the reported aberration values were unadjusted for in vacuo conditions. This means that about 95 km/sec should be added to these values. We were also informed that certain measurements had been done using a zenith tube in conjunction with photography and that these results were higher than those done at the same time by human eye. However, Setterfield's estimate of 300 km/sec was based on a simple ratio of two measurements. We felt that more evidence was required in order to apply the correct adjustment. Therefore we did not correct the data. (If this correction is made the hypothesis of decreasing c is even stronger).
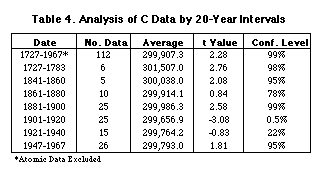
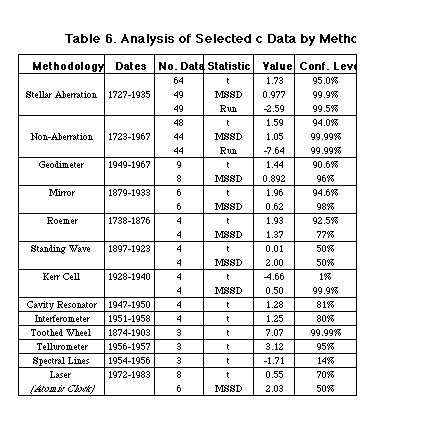
To answer the second question, the measurements of c were analyzed by method of measurement. The results are displayed in Table 6 and ordered according to size of data set. The two largest cells (Aberration and Non-aberration) had significant MSSD and run tests although both t-tests were lower. The smaller cells must be regarded as having insufficient data to be credible. They are reproduced here for completeness. Typical of the credibility problem is the Roemer cell whose tests are not significant, yet a least-squares regression line shows an average decrease of 27.5 km/sec/year which is significant at the 99.99% confidence level. If the Encyclopedia Britannica value of 1771 (Table 1) which we deleted, were to be used, both MSSD and t-test would be significant. The three methods' results which differ substantially from the overall pattern are of some interest. The standing wire results are to be expected of data with large bars and variance. The large difference between the Kerr cell t test and MSSD test are indicative of a systematic error. Although the spectral line method was not deleted, Setterfield does mention problems with the wave length determination.
To answer the third question, we analyzed the data by error bar size. If the decreases in the measured value of c are a result of increased measurement precision we would expect to see a decrease in the significance of the confidence levels as the true value of c is approached. The results are shown in Table 7.
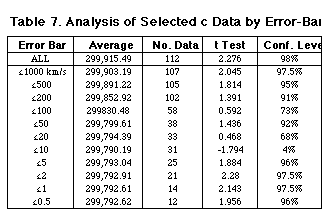
The results may appear at first to be ambiguous---both decreasing levels and steady significant ones. However, from what has been learned from earlier analysis we know the aberration values are systematically low and there are a significant number of them in the 60 to 200 km/sec range---just where the confidence levels are decreasing.
The dramatic drop in confidence levels from ±20 km/sec to ±10 km/sec and the equally dramatic rise between ±10 km/sec and ±5 km/sec tells us that there is a systematic problem with data which have error bars in that range. Kerr cell results provide 4 out of 6 of these data. It must be concluded that our earlier suspicions of systematic error in the Kerr cell measurements appear valid.
In order to further test for suspicious sequences that might be a product of experimenter expectations, a search was made for consecutive data where the points were both higher than the current value of c and at the same time decreasing with time. Taking into account that 58% of the data points are higher than the accepted value of c, we found that the occurrences of the above sequences were close to the accepted values. That is, there was no statistically significant deviation from the expected value.
Taking these various problems in the data into account it must be concluded that the decrease in the measurements of c cannot be attributed to the increase in the precision of the measurements.
DISCUSSION
The overall pattern of statistics shows there is a decreasing trend in the measurements of c. All 3 run and MSSD tests on non-atomic-time standard data as well as most tests in each subset were significant. The analysis of distribution, methods, precision, and historical eras produced interesting information on the discrepancies in the data but no pattern of experimental or human error to which decreasing values of c could reasonably be ascribed.
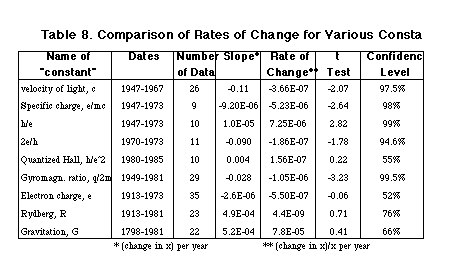
Norman and Setterfield also analyzed (in addition to values of c), measurements of the charge on the electron, e, the specific charge, e/mc, the Rydberg constant, R, the gyromagnetic ratio, the quantum Hall resistance, h/e2, 2e/h, and h/e, various radioactive decay constants, and Newton's gravitational constant G.
Three of these Norman and Setterfield quantities found to be constant, namely e, R, and G. These constants are either independent of time or independent of atomic processes. The other five quantities, which are related to atomic phenomena and which involve time in their units of measurement, they found to trend with the exception of the quantum Hall resistance.
We re-analyzed these data, excluding outliers. Our results, Table 8, differed from Norman and Setterfield's only for the Rydberg constant where we obtained rejection of constancy at the 95% confidence level for the run test (but not the MSSD). The available measurements of radioactive decay constants do not have enough precision to be useful.
Norman and Setterfield also assumed that photon energy, hf, remains constant over time even as c varies. This forces the value of hc to be constant in agreement with astronomical observations. The consequence of this is that h must vary inversely with c and therefore the trend in the constants containing h are restricted as to their direction. We calculated the least-squares straight line for all the c-related constants and found no violation of this restriction. In all cases the trends in "h constants" are in the appropriate direction. In addition, a least squares line was plotted for c, the gyromagnetic ratio, q/mc, and h/e for the years 1945-80. The slopes continued to remain statistically significant, and in the appropriate direction. Furthermore the percentage rate of change varied by only one order of magnitude---very close, considering how small some of the cells are. By contrast, the t test results on the slopes of the other three constants (e, R, and G) were not statistically significant.
CONCLUSIONS
We conclude that:
We hope that other researchers can suggest some testable implications of the variable c hypothesis, and that others can suggest how we might obtain "fossil" values for c---that is, values of c prior to the first experimental measurements. We hope also that researchers will be stimulated to reexamine the original c data measurements themselves. This might make a good doctoral dissertation. Also, we suggest there is a need to quantify the apparent systematic errors that are found in the aberration and Kerr cell data.
Since a non-constant velocity of light (and related changes in certain other "constants" of nature) has profound implications for cosmology and physics we urge further study of the working hypothesis that c is not a fixed constant. For example, Troitskii has suggested a theoretical cosmology in which c is allowed to vary. He claims his model fits the available data as well as the current Big Bang cosmology (Ref 10).
REFERENCES
1. de Bray, M. E. J. Gheury, The Velocity of Light, Nature, 127, 522, Apr. 4, 1931
2. Van Flandern, T. C., Is the Gravitational Constant Changing? Precision Measurements and Fundamental Constants II, B. N. Taylor and W. D. Phillips (editors), National Bureau of Standards Special Publication 617, 1984.
3. Setterfield, Barry and Norman, Trevor, The Atomic Constants Light and Time, Special Research Report prepared for Lambert Dolphin, SRI International, Menlo Park, CA., August 1987.
4. Birge, Raymond T., The General Physical Constants, Reports on Progress, in Physics 8, 1941.
5. Dorsey, N. E., The Velocity of Light, Transactions of the American Physical Society, 34, Part 1, Oct. 1944.
6. Froome, K. D. and Essen, L., The Velocity of Light and Radio Waves, Academic Press, London, 1967.
7. Bhattacharyya, G., and R. Johnson, Statistical Concepts and Methods, (1977), John Wiley and Sons, New York.
8. Crow, E. L., F. A. Davis, and M. W. Maxwell, Statistics, (1978) Coles Publishing, Toronto.
9. Draper, N. S., and H. Smith, Applied Regression Analysis, (1966), John Wiley and Sons, New York.
10. Troitskii, V. S., Physical Constants and Evolution of the Universe, Astrophysics and Space Science, 139, (1987) pp. 389-411.
______________
Published in Galilean Electrodynamics, Vol. 4, no. 5, Sept/Oct 1993
Copyright 1993 by Galilean Electrodynamics, PO Box 545 Storrs, CT 06268-0545.