by Lambert Dolphin
![]()

Display created by Ed Stephan http://www.ac.wwu.edu/~stephan/
Genesis 4 and 5 records the history of the Antediluvian world
in a highly condensed account. From the genealogical list, which
is probably complete without any gaps, the time between Adam and
the flood of Noah---which occurred when the latter was 600 years
old---can be calculated to be almost exactly 1656 years. If one
takes Barry Setterfield's chronology
as more accurate, the time period from Adam to the Flood was
2256 years.
During this time period, man was much healthier than he is now;
the gene pool, less corrupted by subsequent harmful mutations
and other defects; and the environment on earth, was much more
favorable to good health and long life, as can be seen by the
recorded pre-flood longevities.
While classical evolutionary theory presupposes earth's early
atmosphere was a reducing atmosphere (devoid of Oxygen) newer
scientific evidence confirms what Bible scholars had previously
suspected: the earth's ancient atmosphere probably contained a
larger fraction of oxygen than it does at present. It is even
possible that photosynthesis in plant life was more efficient
than it is now. A warmer average climate in ancient times would
also mean a higher rate of oxygen generation by the more numerous
plant life.
At age 65, Enoch became the father of a son whom he named Methuselah,
a name which means "when he dies it (the flood) shall come."
Enoch went on to walk with God another 300 years and was taken
up ("translated") into heaven by God without dying.
Methuselah survived to age 969, the oldest man who ever lived.
True to prediction, the flood came the year Methuselah died.
Ray C. Stedman in his book Understanding Man has
analyzed the meaning of the names of the descendants in the line
of Seth to Noah and gives the following explanation:
"a way of escape [for man] is indicated again in a most fascinating way in this chapter by the meaning of the names listed. There is some difference among authorities as to the meaning of these names, depending upon the root from which they are judged to be taken. But one authority gives a most interesting sequence of meanings. The list begins with Seth, which means 'Appointed.' Enosh, his son, means 'Mortal;' and his son, Kenan, means 'Sorrow.' His son Mahalalel, means 'The Blessed God.' He named his boy Jared which means 'Came Down,' and his boy, Enoch, means 'Teaching.' Methuselah, as we saw, means 'His death shall bring;' Lamech means 'Strength,' and Noah, 'Comfort.' Now put that all together:
God has Appointed that Mortal man shall Sorrow;
but The Blessed God, Came Down,
Teaching, that His Death Shall Bring,
Strength and Comfort."Is this book (Genesis) from God? God has given you and me a life to watch just as Methuselah's generation watched his. It is your own life. God has written "Methuselah" on each one of us. "His death shall bring it," or "When he dies, it will come." How far is it till the end of the world for you? When you die. That is the end of the world. That is the end of man's day. Is it fifty years from now, ten, tomorrow? Who knows? But at any moment, when he dies, it will come."
![]()
Growth of world population during various epochs of earth history
can be calculated by a well-known formula:
In this formula Pn is the population after n generations
beginning with one man and one woman; n is the number of
generations---found by dividing the total time period by the number
of years per generation.
The variable x can be thought of as the number of generations
that are alive when P(n) is evaluated. Therefore, if x is 2, the
generations that are alive are generations n and n-1. This means
that only a generation and its parents are alive. It seems reasonable
to choose x = 3 most of the time. Taking x = 3 means that when
P(n) is evaluated generations n, n-1, and n-2 are all alive.
C is half the number of children in the family. If each
family has only two children, the population growth rate is zero,
but a reasonable and conservative number of children per family
is 2.1 to 2.5 as far as historical records are concerned. (The
derivation of the above equation has been added as Note A at the
end of this article).
Allowing for famine, disease, war, and disaster, a few sample
calculations will show that the earth's population could have
easily reached several billions of people between the time of
Adam and the time of the flood. It is even quite possible that
the preflood population was much higher than it is now.
Genesis 4:21-22 gives suggestions of the development of music
and advanced technology during this period. Family reunions must
have been spectacular affairs with average life-spans well over
900 years! Human culture and even technological achievements before
the flood may well have been superior and dazzling in comparison
to what we see now, even though evil in that society eventually
increased to the point of that civilization's self-destruction.
When the Flood destroyed the Antediluvian world only eight persons
were rescued on the Ark of Noah.
A home computer spread sheet or a hand calculator can be used
to iterate world population growth rates for various realistic
values of n, C, and x. This will soon convince the skeptic that
the earth can be easily filled full of people in a few thousands
of years.
Henry Morris (Ref. 1) gives the following examples of possible
population growth rates of the earth at various times in history:
"...Assume that C = 2 and x = 2, which is equivalent to saying that the average family has 4 children who later have families of their own, and that each set of parents lives to see all their grandchildren. For these conditions which are not at all unreasonable, the population at the end of 5 generation would be 96, after 10 generations, 3,070; after 15 generations, 98,300; after 20 generations, 3,150,000; and after 30 generations, 3,220,000,000. In one more generation (31) the total would increase to 6.5 billion.
"The next obvious question is: How long is a generation? Again, a reasonable assumption is that the average marriage occurs at age 25 and that the four children will have been born by age 35. Then the grandchildren will have been born the parents have lived their allotted span of 70 years. A generation is thus about 35 years. Many consider a generation to be only 30 years. This would mean that the entire present world population could have been produced in approximately 30 x 35, or 1,050 years.
"The fact that it has actually taken considerably longer than this to bring the world population to its present size indicates that the average family is less than 4 children, or that the average life-span is less than 2 generations, or both. For comparison, let us assume then that the average family has only 3 children, and that the life-span is 1 generation (i.e., that C = 1.5 and x = 1). Then...in 10 generations the population would be 106 after 20 generations, 6,680; after 30 generations, 386,000; and after 52 generations, 4,340,000,000...At 35 years per generation, this would be only 1,820 years. Evidently even 3 children per family is too many for human history as a whole."
With regard to the Old Testament and the time period between
Adam and Noah, Morris says,
"...the recorded average age of the nine antediluvian patriarchs was 912 years. Recorded ages at the births of their children ranged from 65 years (Mahalalel, Gen. 5:15; Enoch, Gen. 5:21) to 500 years (Noah, Gen. 5:32). Everyone of them is said to have had "sons and daughters" so that each family had at least 4 children, and probably more.
"As an ultraconservative assumption, let C = 3, x = 5, and n = 16.56. These constants correspond to an average family of six children, an average generation of 100 years and an average lifespan of 500 years. On this basis the world population at the time of the Flood would have been 235 million people. This probably represents in a gross underestimate of the numbers who actually perished in the Flood.
"Multiplication was probably more rapid than assumed in this calculation, especially in the earliest centuries of the antediluvian epoch. For example, if the average family size were 8, instead of 6, and the length of a generation 93 years, instead of 100, the population at the time of Adam's death, 930 years after his creation, would already have been 2,800,000. At these rates, the population at the time of the Deluge would have been 137 billion! Even if we use rates appropriate for the present world (x = 1 and C = 1.5), over 3 billion people could easily have been on the earth at the time of Noah."
With regard to the effects of plagues, wars, and disasters on population growth rates, Ian T. Taylor (Ref. 2.) notes,
"The use of formulas gives the maximum figure possible from the variables that have been selected, and it is cogently argued that natural disasters have always played a hand in keeping human population in check; the long-term picture is thus seen to be one of population stability. History shows, for example, that the Justinian plague, A.D. 540-90, took 100 million lives; the Black Death, A.D. 1348-80, swept away 150 million from Europe alone; and even as late as 1918-19, the influenza epidemic took 25 million lives (Wallace 1969; Webster 1799)... the awful figures for natural disasters are very quickly made up for by the subsequent rates of increase among the survivors (Langer 1964)." Taylor gives the following typical recovery curve after a plague for which data is available:
Consider the descendants of Jacob (Israel) who numbered 70 persons
(Ex. 1:5, Dt. 10:2) when they went down to stay there while Joseph
was Prime Minister. They remained 400 years (Gen. 15:13, Acts
7:6; Ex. 12:41 says "430 years"), and numbered 600,000
able-bodied men, plus women and children when they left under
Moses (Ex. 12:37, Nu. 11:21). If a generation was 40 years, then
10 generations is the total. A total population of 2 million would
be generated, starting with only couple, if the average number
of children per family was 8, which is an entirely reasonable
number, since Genesis 47:27 says the Jews "multiplied exceedingly"
during their sojourn in Egypt. If a generation were 30 years,
then the number of children per family would have averaged 5.6.
The lifespans of the average person were evidently longer than
today, Moses lived 120 years (Ex. 33:39) and his brother Aaron
123. Their father Amram lived to be 137 (Ex. 6:20).
The above formula readily shows the absurdity of evolutionary
time scales for mankind. In one million years, if n = 23,256 generations,
C = 1.25, and x = 3, the present population of the world would
be
P = 3.7 x 102091 persons.
In contrast the total number of electrons in the universe is only
1090!
Assuming that man has been on the earth for a
million years or so, as the evolutionist adamantly insists, we
calculate that the entire universe would now be filled full of
dead bodies! A population of 1090
in one million years requires that the number of children per
family be less than 2.0176.
The total surface area of the earth is about 5 x 10¹⁴ square meters. If we allowed every
man, woman and child a square meter and filled all the land masses
with people the earth would hold no more than 1014
persons. (That is, one hundred thousand billion persons). In one
million years this number would be reached only if the average
number of children per family were less than 2.0026. The average
number of children per family over the past 2000 years has been
of the order of 2.1.
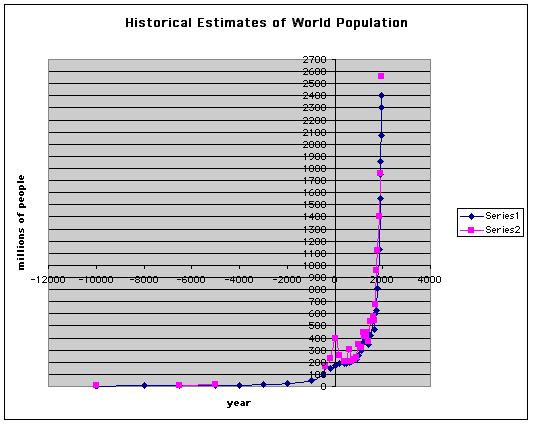
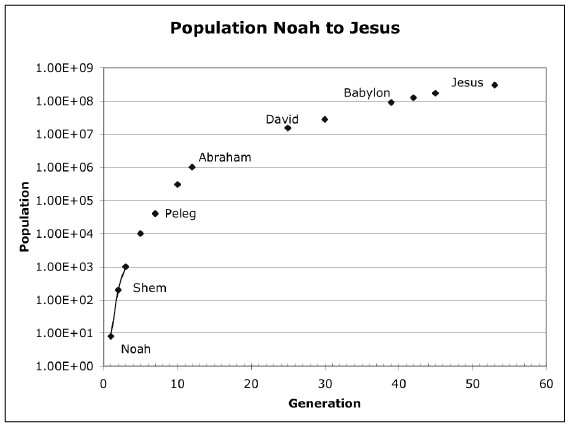
The following chart assumes the human race began with two persons,
Adam and Eve, relatively recently. Population growth was very
rapid for 1656 years until the Flood of Noah reduced the population
to eight persons (4 couples). I have arbitrarily chosen the population
at the time of the Flood as 9 billion, though as shown above this
may be too conservative. Very little data on world population
is available until recent times, so a few intermediate points
have been selected. I have guessed the world population at the
time of Abraham at 5 million. For example there seems to be broad
agreement that the world population at the time of Christ was
between 200 and 300 million. The latest demographic data used
to plot this chart is available on the Internet and is referenced
below. See Note B.
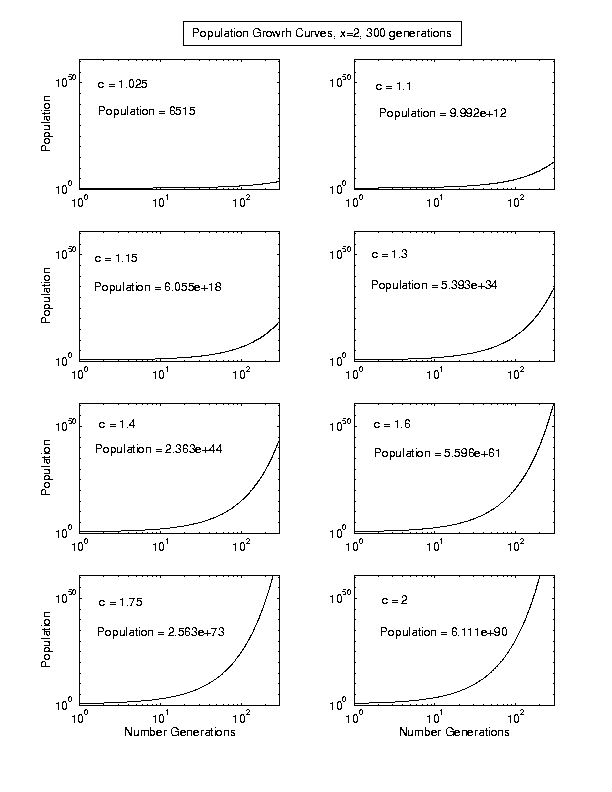
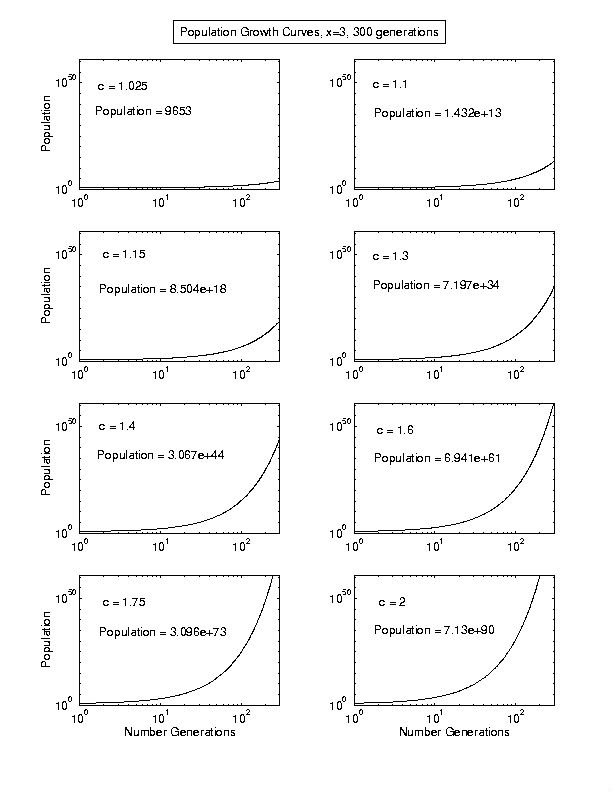
In order to show the narrow range of values of C which will
generate very large populations in a short time, my associate
Gordon A. Hunt of Stanford University (gordo@sun-valley.Stanford.edu)
has plotted sets of curves from the standard population for x
= 2 and x = 3 and for several values of C. His plots are shown
below in Note C.
Note D has been added as a comment on the uncertainty of world
population at the time of Christ.
![]()
The following graph is helpful in correlating population growth of the world with population estimates for the Jewish population in the world from Jewish scholars. Adapted from A Historical Address of the Jewish People, Ed. by Eli Baranavi, Schocken Books, New Yoprk, 1992, by Simon Burckhardt.

![]()
Note A. Derivation of the Population Growth Equation
The formula is a standard one and easily derived.
If one starts with two people and you assume an average of 2c
children per family, then the number of children in the first
generation would be 2c. The total population after one generation would be 2 + 2c.
In the second generation one gets 2c2 individuals, and in the third generation,
2c3 and so on. Assuming no deaths,
at the end of n generations one has
S(n) = 2 + 2c + 2c2 + 2c3 +....+2cn
individuals.
Multiply both sides of the equation by c and subtract from the
previous equation. This gives,
S(n) = 2 [c(n+1) - 1] / (c-1).
However we have to allow for people dying all the time. Let the
average life-span be represented by x generations.
In the nth generation then all those who were in the (n-x) generation
will have died.
Thus,
S(n-x) = 2[c(n-x+1) - 1] / (c-1)
And, P(n), the total surviving population in the nth generation
is,
P(n) = S(n) - S(n-x) = 2[c(n-x+1)][cx - 1] / (c-1).
The way to understand this formula in practice is to use a hand
calculator and play around with some "typical" values
of x and c. If c = 1 then of course the population growth is zero.
We do not know much about ancient population growth rates, but
there is reasonable data for the past 2000 years, and 2.1 children
per family seems to be typical. Evolutionary time scales require
that the average number of offspring over most of history would
have been only of the order of 2.0026 children per family. If
this is the case, why a jump from 2c = 2.0026 to 2c = 2.1 only
in the last 2000 years or so? Helpful illustrative examples can
also be quickly run on a spreadsheet program such as Microsoft
Excel. It is then very easy to vary x and c over a whole range
of limits.
It is impossible to prove conclusively that the world fully populates
itself in only a few thousand years. The point is, this short
time scale scenario is actually more reasonable than millions
of years given what we do know about population growth rates in
the last millennia or two.
Note B. Approximate relationships:
As noted above, we have very little actual population data except
for the past 200 years. For the time of Christ, most demographers
make an intelligent guess that the world population was between
100 and 300 million. The lower figure tends to be preferred.
We are not entirely ignorant of the world population between about
3000 BC and the time of Christ. The size and extent of ancient
cities and their approximate periods of prominence are known from
archaeology. Ancient historians give us some clues, and of course
Christians consider the Bible to be fully accurate as it relates
to Israel and the surrounding region. There is legitimate reason
to speculate on the time interval between Noah and Abraham, but
Abraham's day seems to have been around 2000 BC. The traditional
date for the Exodus of the Jews from Egypt is approximately 1400
BC.
Henry Morris (Ref. 1) offers further comments:
"The evolutionist may object and say that the rate has drastically
accelerated only in recent centuries. So, let us consider that
the "normal" growth was such as to produce only the
earth's population as many people have been born into the world
as it was at the time of Christ, about 200 million people. This
is the oldest date for which anyone has even a reasonable guess
as to the population.
The value of c necessary to give 200 million people in 25,000
generations can be calculated as 1.0007 and the corresponding
number of people who had lived and died in that period would still
be over 300 billion.
Therefore, using the most conservative figures for which we have
even the remotest justification, if the theory of human evolution
is true, there have been at least 300 billion people who have
lived and died on the earth--almost all of them a long time before
Christ came into the world and before any other revelation was
given to man about God!
A good question to consider is: Where were they buried and what
happened to their bones? An even more disturbing question is:
What happened to their souls?
It may be claimed that none of these calculations really prove
anything, since no one really has any way of knowing exactly what
birth and death rates and what population figures existed in prehistoric
times. This is quite true, of course, but the known facts of population
growth do fit the Biblical chronology very well and they do not
fit the assumed evolutionary chronology at all.
Scientists work in terms of "models" and try to evaluate
each proposed model of a particular process in terms of the "degree
of fit" of the known data into that model. On this basis,
we are abundantly justified in concluding that the creationist
model with its brief chronology fits the actual known data of
population statistics far better than does the million-year evolutionary
model. In terms of scientifically-accepted standards of evaluation,
this can only mean that, on this issue at least, creationism is
much more "scientific" than evolutionism.
Other population models could be used, of course, and no one knows
which is best, nor that the assumed rates have been constant.
A simpler approach (as used by Malthus and Darwin) would be to
assume a simple geometric increase in population, and to assume
that only one generation is living at any one time. That is, in
the standard population equation, assume that x = 1. Then the
equation becomes simply:
P(n) = 2 cn
The results using this equation are practically the same as from
the full equation, when n becomes large.
If one wishes to think in terms of a constant annual percentage
increase in population, the population equation can be written
as:
P(y) = 2 (1 + G/100)y years
where G is the annual percentage increase in population and P(y)
is the population after y years. From this equation, one can calculate
that G would have to be about 0.5 percent per year to produce
the present world population in the assumed 4,300 years since
the Flood. This is only one-fourth the present growth rate of
~2 percent per year.
It is possible, of course, to specify changing growth rates of
family sizes on any arbitrary basis one chooses, in order to make
the results come out to any predetermined value. This is what
evolutionists have to do in order to account for such a small
present world population after such a long imagined evolutionary
history. Nevertheless, the simplest and most straightforward population
models, based upon all the real population statistics that are
available, clearly correlate with the Biblical chronology as the
true framework of human history.
The total world population, of course, has long since been subdivided
into various nations and other groupings, even though the original
population was all in one small group. When, and on what basis
did these subdivisions take place? The development of different
nations is in the domain of ethnology."
Note C: Some Plots of the Population Growth Equation.
The following sets of curves are plots of the equation,
Both the x and y axes are logarithmic. The vertical axis is the
total population and the x axis is the number of generations required
to reach a given population starting from 2 people in the first
generation. C is half of the number of children per family, on
average. To convert the horizontal axis to years after creation,
multiply n by the average number of years per generation, i.e.,
the number of years elapsing from first-born to first-born. In
populations where people marry young and have many children population
soars. Thus no society can sustain growth rates where C = 2.5
to 3.0 for very long. On the other hand there is no historical
evidence for very low overall population growth rates over very
long periods of time (hundreds of thousands or millions of years).
The total population after 300 generations is indicated on each
chart.
Note D. Population at the time of Christ
Because of the uncertainty in world population 2000 years ago,
my colleague Eric Charles Abbott has kindly provided the following
note:
Let us put reasonable bounds on the value of the world's population
in AD 1. For the sake of example, I'll choose a lower bound of
50,000,000 (8 significant figures specified), and an upper bound
of 200,000,000 (9 sig. figs. specified). Similarly, I'll put bounds
on the population in AD 1000 at 250,000,000 and 350,000,000 (both
exact).
Note that the world's population must be an integer greater than
or equal to 0; therefore, these values are exact -- there can
be no loss of precision in the calculation due to these numbers.
Using x = 2 (exact) and a generation length of (exactly) 40 years,
we generate the following table :
Population
--------------------------------------------------
AD 1 | AD 1000 | C (rounded for convenience)
--------------------------------------------------
50 mil | 250 mil | 1.0665
200 mil | 250 mil | 1.00897 (min)
50 mil | 350 mil | 1.0809 (max)
200 mil | 350 mil | 1.02264
P(n) is a monotonically increasing function of c for the values
of x and n chosen. Therefore, if the actual populations in AD
1 and AD 1000 lie within the given bounds, then c must lie within
the interval [1.00897, 1.0809].
The following plot is a rough estimate of world population from the time of the Flood of Noah, until the birth of Jesus, (53 generations). For discussion purposes the population at the time of Abraham, eleven generations after the Flood, has been taken to be one million people. The population at the time of Christ was assumed to be 300 million people. The date of the Flood was taken to be about 3500 BC, based on Barry Setterfield's chronology.
![]()
1. Henry M. Morris, The Biblical Basis for Modern Science,
Appendix 6 (Baker Book House; Grand Rapids, 1984). This book gives
many more examples of population growth rates, considerations
of disease, war, famine. etc. Available from the Institute
of Creation Research (ICR). PO Box 2667, El Cajon, CA 92021.
Excerpt: Babel and the World Population:
Biblical Demography and Linguistics.
2. Ian T. Taylor gives his own population estimates consistent
with those of Morris in In The Minds Of Men: Darwin And
The New World Order.
3. Robert Craig Long, author of a very interesting book, "The Politicians: things of heaven and things of earth" has detailed estimates of population growth rates calculated by a different method than given by the above formula. Long's overall conclusions, included on his web page, are similar to those presented above.
4a. World Population Clock and Calculator
4b. World Clock and Age Calculator
5.The Population of the PreFlood World, by Tom Pickett (added April 8, 1998).
6. Population Before the Flood
From Adam to Noah, average human lifetimes were very nearly 1000 years. First-born children arrived when their parents were of the order of 100 years in age. The time period from Adam to Noah is 1656 years in a tight reading of the genealogy, or 2256 years if one chooses to use the preferred Hebrew text of the Old Testament. The First-century historian Josephus, (Antiquities of the Jews, Chap. 2 vs. 3 footnote), says that Adam and Eve had 33 sons and 23 daughters, that is, c = 28. If this was a typical family size, the total world population before the Flood would have been totally beyond any reasonable numbers. There were ten generations from Adam to Noah and a more reasonable family size would appear to be at least 5 children per family. Based on the assumption of 4 to 9 children per family on average, the following sets of curves have been prepared.
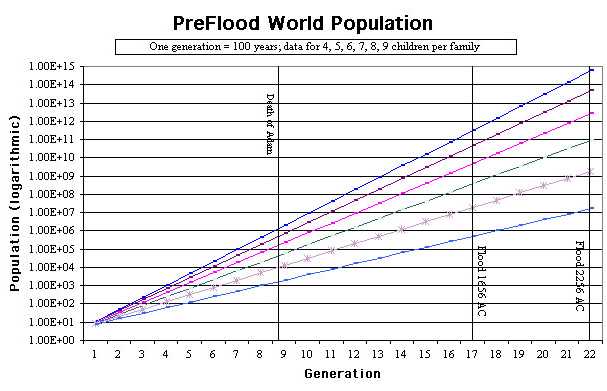
The line of Seth given in Genesis 5 suggests that children began to be born when the parents were of the order of a hundred years old. The name of the son (the heir) is given first in this list and then the text continues, "...and (so and so) begat (other) sons and daughters." This would suggest an average family size of at least 5. But more than 5 or 6 surviving children per generation would lead to an impossibly large total population by the time of the Flood. However, this assumes present-day mortality rates. The genealogies in Genesis 5 all begin with a son. But, there could well have been daughters born earlier, or non-inheriting sons. We are merely told the name of the next in line in the family descent, i.e., the name of the heir.
Small family sizes when men and women were capable of bearing children for more than 400 years seems strange to us today--unless the sexual drive was much different then as compared to now. On the other hand, death rates could have been very high before the Flood. When a new disease appeared suddenly amongst the Antediluvians the death rate might have been enormous. Human bodies as yet had no immunity to new diseases back then, no antibodies to fight a new disease. Humans were created with the capacity to adapt over time to fight germs and infections. Nowadays, late in time, our bodies carry all manner of antibodies against a myriad of germs and infections. But what was it like when our race was just adjusting in a fallen world full of deadly perils?
Probably the world population by the time of the Flood was indeed many billions of people, but there is a lot we do not know about this amazing period of human history before the Flood.
7. A Population Growth Simulation, by Paul Gossilin (in French)
8. U.S. Census Bureau World Population Clocks
9. Human Population Dynamics Revisited with the Logistic Model: How Much Can Be Modeled and Predicted?
10. Population Control Questions, Helen Fryman (Setterfield), CARM
11. Biodiversity and Conservation: A Hypertext Book by Peter J. Bryant
12. Where are all the People? by Don Batten (Creation Ex Nihilo, 23(3):5255 JuneAugust 2001)
13. World Overpopulation Awareness
14. World Population: A Guide to the WWW, by Richard Jensen , July 2005
15. Population Through History, 1 AD-2020 AD--animated maps
16. eHistory : World History 10,000 BC to 2000 AD | Data Plotted: (10,000 BC to 2000 AD)
17. World Population Growth, 1750-2150 (Population Reference Bureau)
![]()
|
(from: http://www.census.gov/ipc/www/worldhis.html) |
|
(Population in millions. When lower and upper estimates are the same they are shown
under "Lower.")
-------------------------------------------------------------------------------------
                      McEv-
                       edy
    --Summary-- Bira- --Durand---     and Thomlinson- -UN, 1973--  UN,
Year  Lower Upper  ben Lower Upper Haub Jones Lower Upper Lower Upper 1995 USBC
-------------------------------------------------------------------------------------
-10000   1  10               4   1  10
 -8000   5               5
 -6500   5  10                        5  10
 -5000   5  20               5   5  20
 -4000   7                  7
 -3000  14                 14
 -2000  27                 27
 -1000  50                 50
 -500  100                 100
 -400  162     162
 -200  150  231  231           150
   1  170  400  255  270  330  300  170  200     200  400  300
  200  190  256  256           190
  400  190  206  206           190
  500  190  206  206           190
  600  200  206  206           200
  700  207  210  207           210
  800  220  224  224           220
  900  226  240  226           240
 1000  254  345  254  275  345     265              310
 1100  301  320  301           320
 1200  360  450  400        450  360
 1250  400  416  416                          400
 1300  360  432  432           360  400
 1340  443     443
 1400  350  374  374           350
 1500  425  540  460  440  540     425              500
 1600  545  579  579           545
 1650  470  545           500  545  500     470  545
 1700  600  679  679           610  600
 1750  629  961  770  735  805  795  720  700     629  961  790
 1800  813 1,125  954           900  900     813 1,125  980
 1850 1,128 1,402 1,241       1,265 1,200 1,200    1,128 1,402 1,260
 1900 1,550 1,762 1,633 1,650 1,710 1,656 1,625 1,600    1,550 1,762 1,650
 1910 1,750                               1,750
 1920 1,860                               1,860
 1930 2,070                               2,070
 1940 2,300                               2,300
 1950 2,400 2,556 2,527       2,516 2,500 2,400    2,486    2,520 2,556
-------------------------------------------------------------------------------------
Sources:
Biraben, Jean-Noel, 1980, An Essay Concerning Mankind's Evolution,
   Population, Selected Papers, December, table 2.

Durand, John D., 1974, "Historical Estimates of World Population:
   An Evaluation," University of Pennsylvania, Population Center,
   Analytical and Technical Reports, Number 10, table 2.

Haub, Carl, 1995, "How Many People Have Ever Lived on Earth?" Population
   Today, February, p. 5.

McEvedy, Colin and Richard Jones, 1978, "Atlas of World Population
   History," Facts on File, New York, pp. 342-351.

Thomlinson, Ralph, 1975, "Demographic Problems, Controversy
   Over Population Control," Second Edition, Table 1.

United Nations (UN), 1973, The Determinants and Consequences of
   Population Trends, Population Studies, No. 50., p.10.

United Nations, 1996, "World Population From Year 0 to Stabilization",
   gopher://gopher.undp.org:70/00/ungophers/popin/wdtrends/histor

U.S. Bureau of the Census (USBC), 1995, "Total Midyear Population for
   the World: 1950-2050", Data updated 2-28-96,
   http://www.census.gov/ipc/www/worldpop.html
|
|
Sources:
Durand: J.D. Durand, 1974. Historical Estimates of World Population: An Evaluation (University of Pennsylvania, Population Studies Center, Philadelphia), mimeo.
D & C: United Nations, 1973. The Determinants and Consequences of Population Trends, Vol. 1 (United Nations, New York).
WPP63: United Nations, 1966. World Population Prospects as Assessed in 1963 (United Nations, New York).
WPP94: United Nations, 1993. World Population Prospects: The 1994 Revision (United Nations, New York)
LR: United Nations, 1992. Long-range World Population Projection: Two Centuries of Population Growth, 1950-2150 (United Nations, New York).
Interp: Estimate interpolated from adjacent population estimates.
6/7/94
Data from the Population Division,
Department for Economic and Social Information and Policy Analysis
World Population reached:
1 billion in 1804
2 billion in 1927, (123 years later)
3 billion in 1960, (33 years later)
4 billion in 1974, (14 years later)
5 billion in 1987, (13 years later)
World Population may reach:
6 billion in 1998, (11 years later)
7 billion in 2009, (11 years later)
8 billion in 2021, (12 years later)
9 billion in 2035, (14 years later)
10 billion in 2054, (19 years later)
11 billion in 2093, (39 years later)
The World-Wide Web Virtual Library: Demography & Population Studies.
Source: Demography & Population
Studies
![]()
Added April 2019
Recent Related Report:
GLOBAL POPULATION GROWTH SLOWING, STUDY SAYS
Increasing Death Rate Could Decimate Developing World
[This text is adapted from a Worldwatch Institute press release dated April 12, 1999, and summarizes findings reported in a new book, "Beyond Malthus:
Nineteen Dimensions of the Population Challenge," by Lester R. Brown, Gary Gardner, and Brian Halweil.]
For the first time since China’s great famine claimed 30 million lives in 1959-61, rising death rates are slowing world population growth. When the United Nations released its biennial population update in late 1998, it reduced the projected world population for 2050 from 9.4 billion to 8.9 billion. Of the 500 million drop, roughly one third is the result of rising death rates.
The two regions where death rates are already rising, or are likely to do so, are sub-Saharan Africa and the Indian subcontinent, which together contain 1.9 billion people, nearly one third of humanity.
This rise in mortality does not come as a surprise to those who track world population trends. The demand in many countries for food, water, and forest products is simply outrunning the capacity of local life support systems. If birthrates do not come down soon enough, natural systems deteriorate and social services fall short, forcing death rates up.
Lester Brown, Gary Gardner and Brian Halweil of the Worldwatch Institute have identified three specific threats that either are already pushing death rates up or that have the potential to do so–the HIV epidemic, aquifer depletion, and shrinking cropland area per person.
"Of these three threats, the HIV virus is the first to spiral out of control in developing countries," says Brown. "The HIV epidemic should be seen for what it is: an international emergency of epic proportions, one that could claim more lives in the early part of the next century than World War II did in this century." In sub-Saharan Africa, HIV already infects one fifth to one fourth of the adult population in Zimbabwe, Botswana, Namibia, Zambia and Swaziland. Barring a medical miracle, many African countries will lose one fifth or more of their adult population to AIDS within the next decade.
The virus has also established a foothold in the Indian subcontinent. With 4 million of its adults now HIV positive, India is home to more infected individuals than any other nation. And with the infection rate among India’s adults at roughly 1 percent–a critical threshold for potentially rapid spread–the HIV epidemic threatens to engulf the country if the government does not move quickly to check it.
In some countries, the HIV virus is reversing gains in life expectancy made in the last several decades. For example, in Botswana, life expectancy has fallen from 62 years in 1990 to 44 years in 1998. In Zimbabwe, it has fallen from 61 years in 1993 to 49 years in 2000 and could drop to 40 years in 2010.
A second consequence of continuing population growth is potentially life-threatening water shortages. If rapid population growth continues indefinitely, the demand for water eventually exceeds the sustainable yield of aquifers. The result is excessive water withdrawals and falling water tables. Since 40 percent of the world’s food comes from irrigated land, water shortages can quickly translate into food shortages.
Dozens of developing countries face acute water shortages early in the next century, but none illustrate the threat better than India, whose population, which is expanding by 18 million per year, will soon reach 1 billion. New estimates for India indicate that water withdrawals are now double the rate of aquifer recharge, a serious matter where half of the grain harvest comes from irrigated land.
"In a country where 53 percent of all children are already malnourished and underweight, a shrinking harvest could increase hunger-related deaths," says Brown. In contrast to AIDS, which takes a heavy toll of young adults, hunger claims mostly infants and children.
The third threat hanging over countries where rapid population growth continues is shrinking cropland per person. As this occurs, at-risk nations become increasingly dependent upon imported food. But those same nations might not be able to afford the imported food–and, eventually, the food simply will not be available, as world import needs exceed exportable surpluses.
Among the larger countries where shrinking cropland per person threatens future food security are Nigeria, Ethiopia, and Pakistan. For example, as Nigeria’s population goes from 111 million today to a projected 244 million in 2050, its grainland per person will shrink from 0.15 hectares to 0.07 hectares. Pakistan’s projected growth from 146 million today to 345 million by 2050 will shrink its grainland per person from 0.08 hectares at present to 0.03 hectares, an area scarcely the size of a tennis court. Countries where grainland per person has shrunk to 0.03 hectares, such as Japan, South Korea, and Taiwan, each import some 70 percent of their grain.
The threats from HIV, aquifer depletion, and shrinking cropland are not new or unexpected. It has been recognized for at least 15 years that the HIV virus could decimate human populations if it was not controlled. Similarly, "the arithmetic of emerging water shortages is not difficult," Brown says. A growing population with a water supply that is essentially fixed by nature means that the water supply per person will diminish over time. The same is true for cropland per person. "The mystery is our failure to respond to the threats associated with continuing population growth," says Brown.
One of the keys to helping countries slow population growth is expanded international assistance for reproductive health and family planning. At the U.N.’s Conference on Population and Development held in Cairo in 1994, it was estimated that the annual cost of providing quality reproductive health services to all those in need in developing countries would cost $17 billion in the year 2000. By 2015, this would climb to $22 billion.
Industrial countries agreed at Cairo to provide one third of the funds, with the developing countries providing the remaining two thirds. While developing countries have largely honored their commitments, the industrial countries, importantly the United States, have reneged on theirs. In late 1998, the U.S. Congress withdrew all funding for the U.N. Population Fund, the principal source of international family planning assistance.
Beyond family planning, the forgiveness of international debts by governments in the industrial world could enable poor countries to make the heavy investments in education, especially of young females, that accelerates the shift to smaller families.
As U.N. delegates prepare in June, 1999 to evaluate the progress made since the 1994 Cairo conference, there is a desperate need for leadership in stabilizing world population as soon as possible, Brown emphasizes.
[The Worldwatch Institute is Washington, DC-based nonprofit research organization that analyzes global environmental and development issues. To order the book "Beyond Malthus: Nineteen Dimensions of the Population Challenge" by credit card, call (in the U.S.) 1-800-555-2028; or visit the institute website, http://www.worldwatch.org/titles/tea.html]
![]()
Update: Growth Rate Slowing; Global Population in 2002 Tops 6.2 Billion, Reports Census Bureau
WASHINGTON, March 22 /U.S. Newswire/ -- The world's population increased by 1.2 percent in 2002 to total more than 6.2 billion, the U.S. Census Bureau said today in a report on global population trends. The rate of increase translated into a net addition of about 200,000 people per day and 74 million per year, roughly equivalent to the population of Egypt in 2002.
According to the report, Global Population Profile: 2002, the pace of global population growth peaked just over a decade ago. The increase of 74 million in 2002 is substantially below the annual high of 87 million people added in 1989-90. The rate of growth is well below the high of about 2.2 percent a year experienced 40 years ago.
Census Bureau projections show the slowdown continuing into the foreseeable future.
Some report highlights:
-- The slowdown in global population growth is linked primarily to declines in fertility. In 1990, the world's women, on average, were giving birth to 3.3 children over their lifetimes. By 2002, the average had dropped to 2.6 children -- slightly above the level needed to assure replacement of the population. Census Bureau projections show the level of fertility for the world as a whole descending below replacement level before 2050.
-- While fertility was the dominant factor underlying national, regional and global population growth during the past 50 years, the large proportion of women in their reproductive years in current national and global populations will account for much of the population change expected to occur over the next 50 years.
-- "Population aging," the rise in all regions in the size of older age groups relative to younger ones, will be an increasingly significant trend in coming decades. The world's older population is expected to grow considerably. In 2050, there will be more than three times as many people age 65 and older as there are today. In contrast, the number of children is expected to remain relatively stable over the next five decades.
-- Census Bureau projections indicate a number of African countries will experience levels of mortality during this decade that will lower the average life expectancy at birth to around 30 years by 2010, a level not seen since the beginning of the 20th century. Much of this decline in life expectancy is likely to result from AIDS (news - web sites) mortality.
The report summarizes the key trends in international demography at the dawn of the 21st century. It is accompanied by a special report on HIV (news - web sites)/AIDS, The AIDS Pandemic in the 21st Century, and a four-page summary, Global Population at a Glance: 2002 and Beyond.
All three were released by the Census Bureau's International Programs Center, which collects and analyzes population and related statistical information from all countries.
Editor's Note: The report can be accessed at http://www.census.gov/ipc/www/publist.html.
![]()
Addendum: Related Article from Nature
From Nature 431, 518 - 519 (30 September 2004); doi:10.1038/431518a
Human evolution: Pedigrees for all humanity
JOTUN HEIN
Jotun Hein is in the Department of Statistics, University of Oxford, 1 South Parks Road, Oxford OX1 3TG, UK. e-mail: hein@stats.ox.ac.uk
Simulations based on a model of human population history and geography find that an individual that is the genealogical ancestor of all living humans existed just a few thousand years ago. Writing on page 562 of this issue, Rohde, Olson and Chang1 address a simple but fascinating question: how far back in time must we go to find an individual who was the ancestor of all present-day humans? After a little consideration, the existence of such an individual (the 'universal ancestor' or, as the authors put it, our 'most recent common ancestor') should not surprise: I have two parents, four grandparents, and the growth in the population of my ancestors is close to exponential as I trace them back in time. This is true for anybody's ancestors, and there must soon be an overlap between the ancestors of two or more randomly chosen individuals (Fig.1).

In simplified models, which assume random mating, the average number of generations back to a universal common ancestor has been estimated 2-4 to be around log2n, where n is the population size. So if, for instance, the present-day population were to consist of 1,000 people, the average number of generations back to the universal ancestor would be log2(1,000) " about 10 generations. For populations of size 106, or the present human population of size 6 x 10⁹, it would be 20 or 33 generations, corresponding to 500 or a bit more than 800 years, respectively (assuming a generation time of 25 years). This is surprisingly recent.
And an even more surprising conclusion from such models is that, only a little farther back in time, a large fraction of the population will be the ancestors of everybody alive today. The remaining individuals back then will be the ancestors of no one. As Rohde et al.1 describe it, "When genealogical ancestry is traced back beyond the [universal ancestor], more and more people in earlier generations become ancestors of the [whole] present-day population". At a certain point in history (the 'identical ancestors' point), people can be divided into two groups: either they are common ancestors of all present-day humans, or their lineages have died out. Being the ancestor of only some living humans is not an option. At this point, Rohde et al. say, "everyone alive now had exactly the same ancestors". In the simplest model, the fraction of 'ancestors-of-all' is about 80%, and in most estimates so far, the time back to the 'identical ancestors' point is a bit less than twice the number of generations back to the first universal ancestor.
These estimates are not only astonishing, however; they are also unrealistically low, because of the simplicity of the underlying models. Key missing factors are geography (which influences population structure) and history (which affects population growth), and these are the ingredients that Rohde et al. have taken seriously to arrive at more credible estimates of the time back to the universal and identical ancestors.
The authors carried out simulations based on several scenarios, incorporating different degrees of population growth and different degrees of isolation of subpopulations, with occasional migration linking these subpopulations. The authors' first model is relatively simple and includes up to ten large subpopulations, which exchange just one pair of migrants per generation. In one set of estimates based on this model, the mean time back to the universal ancestor is 2,300 years (76 generations, assuming a generation time of a bit less than 30 years) and to the identical ancestors it is 5,000 years (169 generations) " the time of Aristotle and the first pyramids, respectively. The latter date is especially startling: had you entered any village on Earth in around 3,000 BC, the first person you would have met would probably have been your ancestor! A considerably more detailed model, which describes population density within continents, the opening of ports and more, does not change these estimates much.
The main weakness in the models comes from migration. As the authors point out, if one region is totally isolated (something that they do not simulate), with no migrants connecting it to other subpopulations, then the universal ancestor must logically have lived before the period of isolation began. Only after that period ends would the dates for the universal ancestor become less distant. Because of the effects of isolation, had we been living in 1700, say, and tried to work out when our universal and identical ancestors lived, the answers would have been further back in time than the answers we obtain now. Tasmania, for instance, was conceivably completely isolated at the time, and probably had been for millennia; this would therefore have pushed back the dates for universal and identical ancestry. So uncertainties about population structure introduce uncertainty into the proposed dates.
The genealogical questions addressed by Rohde et al. are distinct from questions about the history of our genetic material. In models that trace genetic material back in time, any given nucleotide position in our genomes can eventually be found in a single individual and on a single chromosome. Thus, being in the pedigree of all of humanity does not imply that an individual makes a significant genetic contribution to the present population. In fact, that individual might have contributed nothing. This distinction is also illustrated by 'mitochondrial Eve' -- the woman who purportedly lived hundreds of thousands of years ago and carried mitochondrial genes that are ancestral to all present mitochondrial genes. In Fig. 1 you would reach this Eve by tracing only female lineages backwards (rather than both lineages).
Universal common ancestry (in the pedigree sense) and genetic common ancestry thus occur on different timescales. The former is proportional to log2n, and if you were to double the current population size, the expected time back to the universal ancestor would move back by only one generation in the simple model. But the time back to the genetic common ancestor is typically proportional to the population size, and so doubling the population size would double the time back to that kind of ancestor. The fact that the number of ancestors in a pedigree increases exponentially, whereas the number of genetic ancestors increases much more slowly, has the consequence that not many generations ago (about six), members of our pedigree existed that did not contribute to us genetically. So being somebody's great-great-great-great grandparent is no guarantee of genetic relatedness. To properly understand genetic ancestry, we need the concept of the ancestral recombination graph5, 6 a generalization of traditional phylogeny that traces genetic material back in time in the presence of genetic recombination.
The increased ease of obtaining genome-sequence data from individuals, and the number of large-scale projects cataloguing variation in the human population, will increase our ability to test hypotheses about human history. Combining pedigree and genetic ancestry will become more and more important, both for data analysis and in exploring properties of population models 7. Many interesting questions lie ahead. For instance, how much genetic material (if any) did the universal ancestor pass on to the present population? What about that for a non-universal ancestor from the same time? In the idealized models, how far back would one have to go to find a single couple who are the lone ancestors of everybody? And how much could be known about humanity's pedigree if we knew the genome of everybody?
References
1. Rohde, D. L. T., Olson, S. & Chang, J. T. Nature 431, 562566 (2004). Article |
2. Kammerle, K. J. Appl. Prob. 27, 880885 (1989).
3. Chang, J. Adv. Appl. Prob. 31, 10021026 (1999). | Article |
4. Derrida, B., Manrubia, S. C. & Zanette, D. H. J. Theor. Biol. 203, 303315 (2000). | Article | PubMed | ChemPort |
5. Griffiths, R. C. Theor. Popul. Biol. 19, 169186 (1981).
6. Hudson, R. R. Theor. Popul. Biol. 23, 183201 (1983). | PubMed | ChemPort |
7. Hein, J. J., Schierup, M. H. & Wiuf, C. H. Gene Genealogies, Variation and Evolution (Oxford Univ. Press, 2004).
8. Total Numbers: How Many People Have Ever Lived on Earth? | How Many People Have Ever Lived?
9. Wikipedia Summary Article: Population
![]()
Lambert Dolphin
lambert@ldolphin.org
Library
Originally written 1987, last update July 31, 2007. April 9, 2019.