Problems for the Big Bang
from the James Webb Space Telescope (JWST)
Barry Setterfield
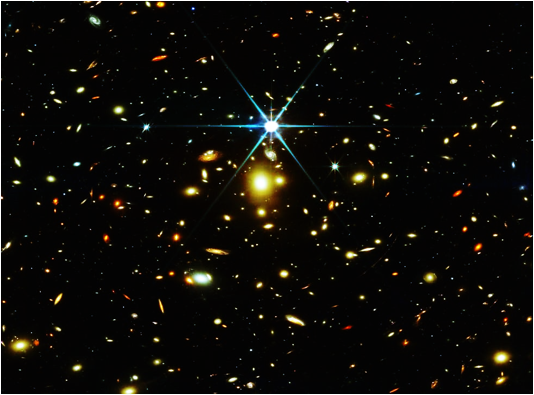
JWST Image credit NASA, ESA, CSA, STSci.
The Big Bang Never Happened
New November 24, 2023
James Web Space Telescope & Plasma Astronomy – published September 20th 2023.
https://www.onlinescientificresearch.com/articles/reviewing-an-option-presented-by-jwst-images.pdf
The Redshift and the Zero Point Energy – Published October 10th 2023.
https://www.onlinescientificresearch.com/articles/reviewing-redshifts-and-the-zero-point-energy.pdf
Reviewing the Role of Virtual Particles in the Vacuum - Published November 27th, 2023.
https://www.onlinescientificresearch.com/articles/reviewing-the-role-of-virtual-particles-in-the-vacuum.pdf

Plasma Astronomy and the Bible
Paperback – June 15, 2023
by Ellen J McHenry (Author)
This book is based on the writings and video presentations of Barry J. Setterfield.
Two fields of science, plasma astronomy and stochastic electrodynamics (SED physics),
are combined to make a cosmology that can defend the Bible's claim that light was created before the sun,
and that "the heavens in their vast array" were completed in less than a week.
This cosmology can also offer explanations for many things that puzzle astronomers
such as why there appears to be missing matter in the universe,
why the universe appears to be expanding (but isn't), why so many nebulae are symmetric, and why the most distant galaxies look mature.
Setterfield's work is based on the research of many distinguished scientists over the past century,
including current "pioneer" physicists who are examining the fundamental principles underlying matter and space. (Amazon Books)
The Basement Workshop
The Work of Barry Setterfiel
ZIP Drive file of all of Barry's videos.
Introduction to the Problem:
The images being obtained by the James Webb Space Telescope (JWST), such as the above, have been awe-inspiring to many. They show a great multitude of brilliant galaxies in the vastness of the universe, and so far back in time that they are very close to the inception of the cosmos, or, colloquially, the moment of the Big Bang. Many scientists have been surprised by the number of galaxies; thousands of times the anticipated number of galaxies have been imaged. “No one was expecting anything like this,” says Michael Boylan-Kolchin of the University of Texas, Austin [1]. “Galaxies are exploding out of the woodwork,” says Rachel Somerville of the Flatiron Institute [1]. “This is way outside the box of what models were predicting,” says Garth Illingworth of the University of California (UC), Santa Cruz [1].
Since the first results came in on 12th July 2022, a series of scientific papers has also registered surprise, disbelief and even panic! Indeed, “Panic” was the first word used in the title to an article about JWST results by 16 astrophysicists led by Leonardo Ferreira [2]. Authors of other papers report that there are many more full-sized galaxies than expected; many stars seem over a billion years old, and had an abundance of elements that theory suggested should have taken over 5 billion years to build up. Yet this multitude of mature galaxies with smooth disks and neat spiral arms is only 235 to 500 million years out from the beginning of it all, the Big Bang event (BB). All the new data flies in the face of BB theory which has been built up over the last 75 years and taught that way publicly by the BB theorists. These theorists are facing a crisis. “Right now, I find myself lying awake at three in the morning,” says Alison Kirkpatrick, an astronomer at the University of Kansas in Lawrence, “and wondering if everything I’ve done is wrong” [3].
Summarizing the Big Bang Model:
The many scientific papers contrast the JWST data with the standard BB model. In that model, it is postulated that, for some time after the beginning, there was a dark period with no galaxies or stars. It was initially expected that this dark period would last for some 500 million atomic years up to 1 billion years after the BB [4]. After that, galaxies should only gradually appear and their numbers start to build up. These early galaxies were expected to be ragged and even disrupting each other until full-sized galaxies had formed and stabilized.
This Big Bang model, which these astrophysicists and cosmologists have been promoting, is based on gravitational interactions forming all structures in the universe. In summary, it goes something like this: After the initial BB event, matter had to cool down, form neutral atoms, and by a gradual process of gravitational agglomeration, organize itself to form the first stars & then very small galaxies. These very small galaxies then collided and interacted with each other to build up bigger galaxies and the gravitational process continued to eventually form much larger, full-sized galaxies. The stars within those galaxies built up the various elements in their interiors by a process of nuclear burning and then, at the end of their life cycle, exploded these elements into their environs. It is thought that it would take 3 successive generations of such stars to provide the proportions of the various elements and their observed quantities.
Distance of Images from the BB Origin:
Galaxy distances are measured by their redshifts designated by the letter “z.” The higher the number the more distant they are and hence closer to the initial BB event. The earliest galaxy seen by Hubble space telescope had a redshift of z = 11, thought to be about 400 million years after the BB. This was a surprise, since it was so close to the Big Bang. [5]. They expected the earliest galaxy to be up to one billion years after the BB. But more surprises were in store.
The Webb telescope was expected to penetrate the dark period to z = 20 or about 180 million years after the BB [6]. The initial Webb telescope results encompass redshifts from z = 11 back to z = 16.7. This latter value translates to 235 million years after the BB [7]. In other words, this telescope’s first exploration is looking at structures that were in existence from about 400 million years right back to only 235 million years after the Big Bang [5, 6, 7]. This has caused some problems with the standard model.
Galaxies Far More Numerous than Expected
First, in contrast to the BB model, which predicts only a very few disorganized galaxies at the beginning, the galaxies become more numerous, not less, as the moment of the BB is neared. At a redshift of z = 5 galaxies are 10 times more numerous than theory predicted [8]. At redshifts greater than z = 10, galaxies are 100,000 times more numerous than expected [8].
Galaxies Fully Mature Extremely Early:
Second, these distant, early galaxies are fully mature, with smooth disks and neat spiral arms [2, 8]. For this to happen just 235 million years after the BB is impossibly early for standard cosmology. Even the possibility that some galaxies seen in the Webb telescope are 400 million years after the beginning defies their model. The problem is much worse if they are at the minimum distance for this data set of 235 million years from the BB.
Galaxies Massive Without Any Sign of Mergers:
Third, there is no sign of galaxy mergers building up to these bigger galaxies [2]. And these galaxies are full-sized spirals, like our own Milky Way system. The masses of these galaxies range from 10^9 (one billion) up to 10^11 (one hundred billion) suns which is normal for large galaxies [8]. In other words, these galaxies give no appearance of being built up by mergers with smaller objects, but they already exist, fully formed, extremely close to the origin of the cosmos.
Galaxies Extremely Brilliant:
Fourth, many of those early galaxies are brilliant. The measurements suggest they may be up to 600 times more brilliant than galaxies in our immediate area [9]. The expectation had been that galaxies would start out relatively fainter and build up mass and brightness with time. That is not what the Webb telescope shows. The original early brightness of these galaxies compared with the much lower brightness of galaxies now, ties in with the increasing brilliance of quasars as we go closer to the origin [10].
Stars in these Galaxies Appear Mature:
Fifth, the Webb telescope has a variety of filters which allow the colors of the stars in these galaxies, and their composition, to be determined. Gravitational astronomy has a color-mass relationship which gives the approximate age of the stars, as does the amount of hydrogen present, if nuclear burning has occurred. Using these factors indicates that stars in these extremely early galaxies show an equivalent of 1 billion years of burning [11]. Yet these galaxies are not even 500 million years from the BB, let alone having had a billion years of burning for their stars once they had formed. This unexpected result calls into question this whole BB approach to the age of stars.
Chemical Elements Present in the Galaxies:
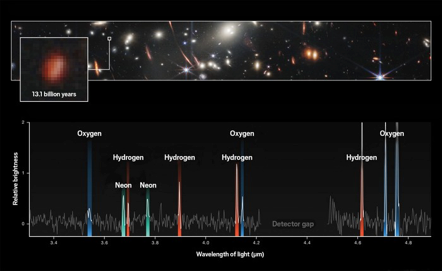
The Near-Infrared Spectrograph on the James Webb Space Telescope identified the chemical composition (bottom) of a galaxy that emitted light 13.1 billion years ago (top). Image credit: NASA, ESA, CSA, STSci
Sixth, in this image from the Webb telescope, the filters and other equipment have determined, from the characteristic wavelengths of emitted light, that the elements hydrogen, oxygen and neon are present and prominent [12]. This is a problem for current Big Bang theory. At this early stage in galaxy development, only the elements hydrogen and helium should be prominent with small quantities of lithium and beryllium. The elements oxygen and neon were not meant to be present initially, but rather built up in the interiors of stars and then exploded out into the host galaxy. According to BB theory, the time for these elements to become prominent in galaxies is of the order of billions of years. Yet here they are enriching a galaxy only a few hundred million years after the origin.
JWST Data Question Accelerating Expansion:
Seventh, one class of statements by astronomers is confusing when the Webb telescope data are considered. These astronomers are locked into a scenario with an accelerating expansion of the universe, when in fact the data disprove that. A word of explanation is thus needed to see the problem. Under ordinary circumstances, an object of a given size will look smaller and smaller with increasing distance; the farther away from you it is, the smaller it looks. However, with the accelerating expansion of the cosmos, in vogue since about 2000, a different optical effect kicks in. Beyond a certain point when distance has already made them small, objects will begin to look larger and larger with distance, not smaller and smaller. This is because their light is meant to have left them when they were much closer to us.
As a result of this theoretical accelerating expansion, astronomers and cosmologists were expecting the galaxies to look larger than would normally be expected for that distance. Instead, it can be shown that they were the right size for that distance under ordinary circumstances, but smaller than the accelerating model predicted. Since these scientists still held to accelerating expansion, the only way they could explain these results was if these galaxies were very small. This ignores the fact that these galaxies had masses up to 100 billion suns with well-ordered disks and neat spiral arms. If they truly were as small as these cosmologists claim, the density of these galaxies would be impossibly high. All the other data indicate these galaxies are the same size as our Milky Way system, as referenced by other researchers such as [8]. Since the accumulation of data show that the effects of accelerating expansion are not present, then different options should be considered, as in reference [13].
Summary of Results from the Webb Telescope:
In summary, the JWST, or Webb telescope, has imaged galaxies ranging from 235 million years out to 400 million years after the BB beginning. There are little or no signs of galaxy mergers occurring. However, these galaxies have masses of 1 billion up to 100 billion stars like our sun. They are also fully mature and have smooth disks and neat spiral arms. The galaxies are up to 100,000 times more numerous than expected and are very much closer to the moment of the Big Bang than any theory predicted. Furthermore, their brilliance, up to 600 times that of galaxies in our own area, contrasts with the expectation that galaxies start off small and faint, and increase in mass and brilliance with time. Despite being so close to the BB beginning, the stars which make up these galaxies seem mature as they have the color characteristics and a hydrogen abundance associated with an age of about one billion years. This is supported by the presence of other chemical elements. Finally, the Webb telescope data indicate that the expected effects of accelerated cosmic expansion are not present, so that idea also needs to be re-examined.
Conclusion:
From the above abbreviated list of Webb telescope data, it appears that the cosmos started off in an almost pristine condition, then faded with time. It also appears the Big Bang Model is in need of a total overhaul, or perhaps a new approach altogether is required. It is apparent that full maturity and brilliance for galaxies and stars was achieved as early as 235 million years after the Big Bang. With the standard model based on gravitational interactions, this is an impossibility, even given the most favorable conditions. There are a few alternatives left to consider. A key one is plasma physics applied to astronomy based on the laboratory plasma experiments of Anthony Peratt in LANL. There he showed that plasma interactions can form all the various types of galaxies very quickly [14]. Reference [15] applies these principles to recent astronomical discoveries. Using all this information, it seems possible, using known physics, to formulate a model different from the standard BB, but still in conformity with the JWST data and its time constraints [16].
Barry Setterfield, 19th August, 2022.
REFERENCES:
[1] https://www.science.org/content/article/webb-telescope-reveals-unpredicted-bounty-bright-galaxies-early-universe
[2] Panic! At the disks…Leonardo Ferreira et al., https://arxiv.org/abs/2207.09428
[3] Alison Kirkpatrick, Astronomer, Uni. of Kansas in Lawrence, https://twitter.com/AkAstronomy/status/1552350497729904640
[4] https://stardate.org/astro-guide/galaxy-formation
[5] https://www.space.com/11386-galaxies-formation-big-bang-hubble-telescope.html
[6] https://en.wikipedia.org/wiki/Chronology_of_the_universe
[7] https://www.ed.ac.uk/news/2022/edinburgh-astronomers-find-most-distant-galaxy
[8] A very early onset of massive galaxy formation, Ivo Labbe et al., https://arxiv.org/abs/2207.12446 Accepted by Nature Journal.
[9] Early results from GLASS-JWST III: Galaxy candidates from z =9 to z= 15, Marco Castellano et al. https://arxiv.org/abs/2207.09436
[10] Quasars, redshifts and controversies, pages 1-4. H. Arp, Interstellar Media,1987.
[11] https://interestingengineering.com/science/james-webb-telescope-will-reveal-dawn-of-cosmos
[12] https://cen.acs.org/physical-chemistry/astrochemistry/first-James-Webb-Space-Telescope/100/i25
[13] Observations contradict galaxy size and surface brightness predictions…
E.J. Lerner, Monthly Notices of the Royal Astronomical Society, Volume 477, Issue 3, July 2018, Pages 3185–3196, https://doi.org/10.1093/mnras/sty728
[14] A.L. Peratt, Transactions on Plasma Science PS-14 (6), pp.763-778 (December 1986).
[15] A.L. Peratt, Physics of the Plasma Universe, 2nd Edition (Springer-Verlag, 2015)
[16] Plasma Astronomy and the Bible, Barry Setterfield, https://www.youtube.com/watch?v=-J6rbzuhsKM
|
Update from Barry July 12, 2023:
Cosmic expansion may be a mirage
https://www.livescience.com/physics-mathematics/dark-energy/the-expansion-of-the-universe-could-be-a-mirage-new-theoretical-study-suggests
By Robert Lea - [Excerpts from Live Science article]. Original article published 29th June 2023.
New research looking at the cosmological constant problem suggests the expansion of the universe could be an illusion. This rethinking of the cosmos also suggests solutions for the puzzles of dark energy and dark matter, which scientists believe account for around 95% of the universe's total energy and matter but remain shrouded in mystery. The novel new approach is detailed in a paper published in the journal Classical and Quantum Gravity, by University of Geneva professor of theoretical physics Lucas Lombriser.
"In this work, we put on a new pair of glasses to look at the cosmos and its unsolved puzzles by performing a mathematical transformation of the physical laws that govern it," Lombriser told Live Science via email. In Lombriser's mathematical interpretation, the universe isn't expanding but is flat and static, as Einstein once believed. The effects we observe that point to expansion are instead explained by the evolution of the masses of particles — such as protons and electrons — over time.
Lombriser's new framework also tackles some of cosmology's other pressing problems, including the nature of dark matter. This invisible material outnumbers ordinary matter particles by a ratio of 5 to 1, but remains mysterious because it doesn't interact with light. This could also do away with dark energy, the hypothetical force stretching the fabric of space and thus driving galaxies apart. In this picture "there is, in principle, no need for dark energy," Lombriser added.
Actual paper:
https://iopscience.iop.org/article/10.1088/1361-6382/acdb41
Classical and Quantum Gravity PAPER • THE FOLLOWING ARTICLE IS OPEN ACCESS
Cosmology in Minkowski space
Lucas Lombriser1
Published 29 June 2023 • © 2023 The Author(s). Published by IOP Publishing Ltd
Classical and Quantum Gravity, Volume 40, Number 15
Citation Lucas Lombriser 2023 Class. Quantum Grav. 40 155005DOI 10.1088/1361-6382/acdb41
Abstract [in part]
“Theoretical and observational challenges to standard cosmology such as the cosmological constant problem and tensions between cosmological model parameters inferred from different observations motivate the development and search of new physics. A less radical approach to venturing beyond the standard model is the simple mathematical reformulation of our theoretical frameworks underlying it. …
… Alternatively, this may be interpreted as an evolution of fundamental constants. As applications of this reframed cosmological picture, the naturalness of the cosmological constant is reinspected and promising candidates of geometric origin are explored for dark matter, dark energy, inflation and baryogenesis. An immediate observation thereby is the apparent absence of the cosmological constant problem in the Minkowski frame. …”
BJS NOTE: The evolution of fundamental constants has already been extensively explored by research presented in several Journals including the Proceedings of the NPA, 19th Annual Conference, 25th to 28th July 2012, Albuquerque, New Mexico, pages 549-563 (excerpts here) & in a complete form in the NPA Monograph Series, No.1 for 2013, “Cosmology and the Zero Point Energy”
Zero Point Energy, Light and Time
Barry J. Setterfield
Published in the proceedings of the Natural Philosophy Alliance, vol 9, 2012, pp.549-563 and available here:
https://www.barrysetterfield.org/ZPE_light_time/ZPE_light_and_time.html
Abstract: In 1911, Planck’s equations indicated the presence of an energy-intrinsic to the vacuum of space. Called the Zero Point Energy (ZPE), it was discovered to control the properties of the vacuum, including the electric permittivity and magnetic permeability. The ZPE consists of electromagnetic waves of all wavelengths. The initial purpose of this study was to explore the effects of a varying ZPE on atoms and atomic constants, such as Planck’s constant, h, the speed of light, c , and the rest masses of atomic particles, m. The rate of ticking of atomic clocks, including radiometric clocks, can also be shown to be affected, whereas orbital clocks (gravity-based) are not. The ZPE has been shown by Haisch, Puthoff and others to maintain atomic orbits throughout the cosmos. Therefore, an increasing ZPE may mean more energetic orbits, resulting in bluer emitted light through time. This gives an alternate explanation to the increasing red shifts which are seen in progressively more distant galaxies. Alteration of electric and magnetic properties of the vacuum would also affect the speed of plasma interactions. Since the universe is usually considered to have begun as plasma, the rates of galaxy, star and planet formation using plasma physics can be shown to have been more rapid than models based on gravity. This may resolve some astronomical anomalies at the frontiers of the universe. An increasing ZPE also has implications for planetary geology, as well as giving a reason for gigantism in Earth’s fossil record. Finally, many of relativity’s predictions follow logically from the presence of a real ZPE and can be formulated with simple mathematics and intuitive concepts.
4. The ZPE, Atomic Masses and Atomic Time
4.1 The ZPE Origin for Atomic Mass
In order to understand how the ZPE affects atomic time, atomic mass has to be defined. There are a number of problems associated with standard models for atomic masses. Many modern theories envisage the sub-atomic particles (which Feynman referred to as ‘partons’) making up matter as being charged point particles with a form but no intrinsic mass. While this may seem strange initially, it forms the basis of physics research. This concept originated with the long line of investigators, including Planck and Einstein, who developed radiation theory based on the behavior of mass-less charged point particle oscillators. Since the resulting radiation theory was in agreement with the data, the problem was then to understand how mass was imparted to these mass-less oscillators, and hence to all matter.
The problem was basically overcome after 1962, with the development of Stochastic Electrodynamics (SED physics). Contrary to Quantum Electrodynamics (QED physics), SED physics accepts a real physical Zero Point Energy. It is seen as pervading the whole cosmos, instead of it being a mere mathematical abstraction.
SED considers the ZPE itself as the agency that imparts mass to all subatomic particles. SED physicists note that the electromagnetic waves of the ZPE impinge upon all charged, massless particles. This causes them to jitter in a random manner similar to what we see in the Brownian motion of a dust particle bombarded by molecules of air. Schrödinger referred to this “jitter motion” by its German equivalent word, Zitterbewegung. Dirac pointed out that the Zitterbewegung jitter occurs either at, or very close to, the speed of light. This conclusion has been sustained by recent studies and the term "ultra-relativistic" has been used to describe it [50, 51]. The physical reality of the Zitterbewegung was demonstrated experimentally in 2010 with calcium ions by Roos and colleagues; Gerritsma was the lead author of the report [52].
Hal Puthoff explains what happens according to SED physics:
“In this view the particle mass m is of dynamical origin, originating in parton-motion response to the electromagnetic zeropoint fluctuations of the vacuum. It is therefore simply a special case of the general proposition that the internal kinetic energy of a system contributes to the effective mass of that system.” [53] As a result, it has been stated that, even if it is found to exist, “the Higgs might not be needed to explain rest mass at all. The inherent energy in a particle may be a result of its jittering motion [caused by the ZPE]. A massless particle may pick up energy from it [the ZPE], hence acquiring what we think of as rest mass.” [54]
The mathematical calculations of SED physicists quantitatively support this view.
The formulations of Haisch, Rueda and Puthoff show the parton’s rest mass, m, of ZPE origin is given by the equation [55, 56].
m = Γhω2/(4π2c2) ~ U2 ~ h2 ~ 1/c2 (10)
In Eq. (10), ω is the Zitterbewegung oscillation frequency of the particle, while Γ is the Abraham-Lorentz damping constant of the parton. The proportionalities in (10) hold because the terms [Γhω2] which make up the numerator of (10) can be shown to remain constant in a changing ZPE scenario [57]. From (10) it can be seen that energy, E, will be conserved with any change in ZPE strength since atomic masses are changing as the inverse square of the speed of light. Thus, energy E = mc2 will remain constant.}
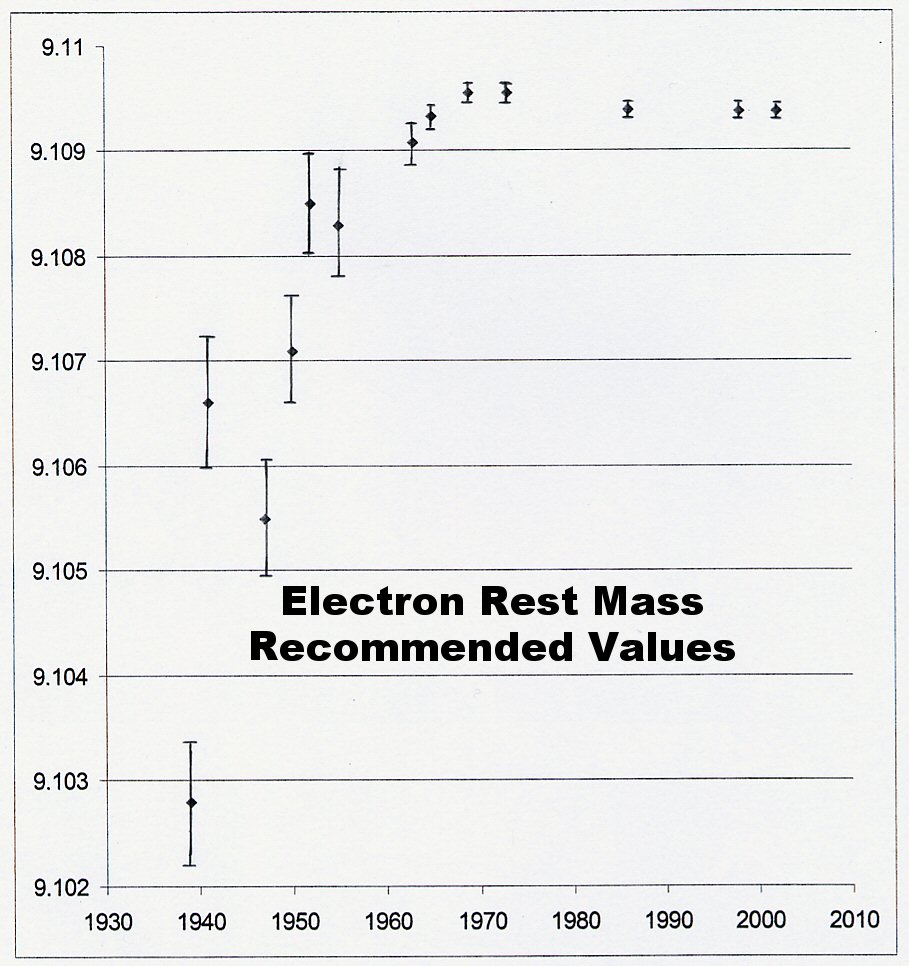
Experimentally, the recommended values of the electron rest-mass, m, support the contention that the ZPE strength was increasing up to about 1970. The graph of these recommended values is given in Fig. 6. A similar graph could be drawn of recommended rest-mass values, m, for the proton. Again a “flat point” can be seen around 1970 supporting the Narlikar-Arp oscillation suggestion.
Fig. 6. Recommended values of electron rest mass, m [17-29]
|

Fragment from new study
Background:
The behavior of the universe has been called into question and whether or not accelerating expansion is really occurring. Our article, which is still being developed, is about the Cosmic Background Radiation (CMBR), Cosmic Expansion and the Zero Point Energy (ZPE). In order to determine the behavior of the universe, the general redshift data and recently acquired Cosmic Microwave Background (CMB) data have been plotted and some important conclusions have emerged from the graph. As part of the investigation, the origin of the Zero Point Energy (ZPE) has given further data supporting an emerging new model for universal behavior. The ZPE has been shown by SED physicists (Puthoff, Haisch, Boyer, de la Pena and others) to maintain the stability of atomic orbits across the cosmos. For a stable orbit, the power absorbed by an electron from the ZPE wave collisions is shown to be equal to the power emitted by the electron’s recoil radiation. The journal New Scientist discussed this in July 1987 and July 1990 under the heading “Why atoms don’t collapse.” With this brief background on the earlier part of the discussion, here is a fragment from this new study, which is not yet complete.
The Cosmic Background Radiation & ZPE Again:
These considerations have important consequences astronomically in the context of this discussion. For example, there is a hidden implication in the above conclusions about the ZPE and atoms. If the strength of the ZPE determines the stability of atomic orbits, this means that, until the ZPE had built up sufficiently, no atomic orbits were stable. This in turn means that until the ZPE strength had reached a certain threshold, it was impossible for neutral atoms to form. In other words, even if the temperature of the universe had dropped to a low enough level with cosmic expansion, it would not be possible to form neutral atoms until the ZPE strength was high enough. Therefore, since the CMB can only form when neutral atoms are possible, then the moment of formation of the CMB was determined more by the ZPE strength than it was by the cosmic temperature. This could mean that at one instant the whole universe is a plasma fog trapping in radiation, but a few seconds later, as the ZPE strength crossed the threshold, the trapped light and radiation would stream out as the whole universe suddenly became instantly transparent.
This brings in the attendant question of what the cosmic temperature was likely to be when the CMB formed. We get some idea of this from the fact that the two dominant elements in the universe are hydrogen (73%) and helium (25%). All the rest only form 2% of the matter in the universe. Laboratory experiments with cooling a high temperature plasma (ions) show that neutral atoms of helium start forming at temperature around 12,000 K. As hydrogen is heated in the lab, ionization has just started at 5800 K. In the reverse process, namely cooling from a high temperature plasma, neutral atoms start forming from hydrogen ions at 6500 K. The Saha equation usually gives this as the ionization temperature for hydrogen. Cosmologists impose special conditions for the CMB to occur and suggest a temperature as low as 3000 degrees K for it to form from hydrogen. Without these special conditions, both hydrogen and helium will exist as neutral atoms at a temperature near 6000 K. This temperature will allow CMB formation once the ZPE has built sufficiently to form neutral atoms.
We can go further. We have already noted that standard cosmology indicates that, as the distance between any two points in the cosmos doubles with expansion, the temperature halves. Furthermore, the redshift and CMB temperature are linearly related as shown by the new data and graph presented above in Figure 13. Therefore, since CMB temperature and redshift are directly related, then the ratios of the CMB temperature at its formation compared with now will give us the redshift, (1 + z), at the time of formation. Thus, a temperature of 6000K / 2.725K = 2202 = (1 + z). This also reveals that the distance apart of any two points in the cosmos has increased linearly by a factor of 2202 since the formation of the CMBR up until the present. This has implications as far as the Zero Point Energy is concerned. This energy arises from the force or tension operating in the “lattice-work” or “fabric” that is the structure of the vacuum, as noted above. This lattice-work is not just linear, but exists in three dimensions. As a result, the ZPE is generated by stretching the lattice by a factor of 2202 in three dimensions. Consequently, the ZPE has increased by a factor of (2202)3 = 1.0677 x 10¹⁰ or say about 1.1 x 10¹⁰ since the CMB formed.
This figure is confirmed by an entirely separate line of thinking. According to SED physics, the number of hits by ZPE waves on the electron per second causing its “jitter-motion” (or zitterbewegung to use the technical term), is given by the Compton frequency, C*. This is equal to 1.2356 x 10²⁰. In the analysis by Spicka et al, they examine the power lost by an electron going around the nucleus as a result of recoil radiation from ZPE impacts and the power gained from the ZPE. One key component in their analysis is the mean free path, λ, of the electron between these collisions. From previous work we have pointed out that the data prove that the quantity (e2 / ε) is constant throughout the universe with all changes in the ZPE (where e is the electronic charge and ε is the electric permittivity of space). Given the constancy of (e/2 / ε), their equations show that the quantity (h2 λ) is also a constant, where “h” is Planck’s constant. SED physics points out that Planck’s second paper of 1911 makes it plain that h is a measure of the strength of the ZPE. Therefore, from Spicka’s analysis, since the strength of the ZPE is given by h, then the equivalent for the electron is given by (√ λ). Since λ is directly linked with the Compton frequency, C*, then the ZPE strength is given by (√ C*) which is
1.11 x 10¹⁰. Since the ZPE built from almost nothing up to its present level by cosmic expansion, then the Compton frequency bears testimony to the fact that the ZPE has increased by a factor of about 1.1 x 10¹⁰ since the CMB formed with the first atoms.
The CMB and ZPE May Answer Some Big Questions:
The information that the ZPE has increased by a factor of about 11 billion since the CMB formation holds the potential to resolve a persistent problem for cosmologists. This ZPE factor means that the electromagnetic properties of the vacuum have been altered considerably since the CMB was formed. According to SED physics, these ZPE electromagnetic waves are like waves on the ocean that meet, crest, peak and form whitecaps and then disappear. However, in the ZPE case, when the waves meet, there is a concentration of energy which allows the formation of virtual particle pairs like an electron-positron pair, or a proton-anti-proton pair or a positive and negative pion. Science has recognized at least 21 different types of such virtual particle pairs, which appear momentarily in the vacuum and then smash together and annihilate, going back to energy. The intense number of such particles appearing and disappearing every moment in a very small volume have caused some physicists to call it “the seething vacuum.” As cosmic expansion continued, the ZPE increased. Space then got “thicker” with energy & virtual particles. Originally, at the time of CMB formation, there would have been very few of these particles.
The importance of this emerged from the studies of Marcel Urban and a team of French astrophysicists from the University of Paris published in The European Physical Journal D for 16th January 2013. It had been pointed out that a photon of light in transit through the vacuum will be absorbed by such particles. A moment later, the particle pair annihilates, the photon re-emitted and goes on its way…only to be absorbed by another virtual particle and, a few moments later, be re-emitted. Each such interaction takes a brief but finite time. Marcel Urban and his team were able to reproduce the current speed of light from the interaction times of photons with virtual particles in the vacuum. Later this was verified in a way that is controversial, Special cameras can take images at 10 trillion frames per second. Using this camera on 27th March, 2019 to photograph a pulse of light going through a bottle it was found that the progression of the photon went in a series of jerks between pauses. It seems that they may have photographed the photon’s interaction with virtual particles at the pauses and its rapid travel between them. Marcel Urban’s team found the interaction times were independent of photon energies. In other words, it didn’t matter what color the light was, or how energetic the photon was, the interaction time of light photons with the virtual particles was the same.
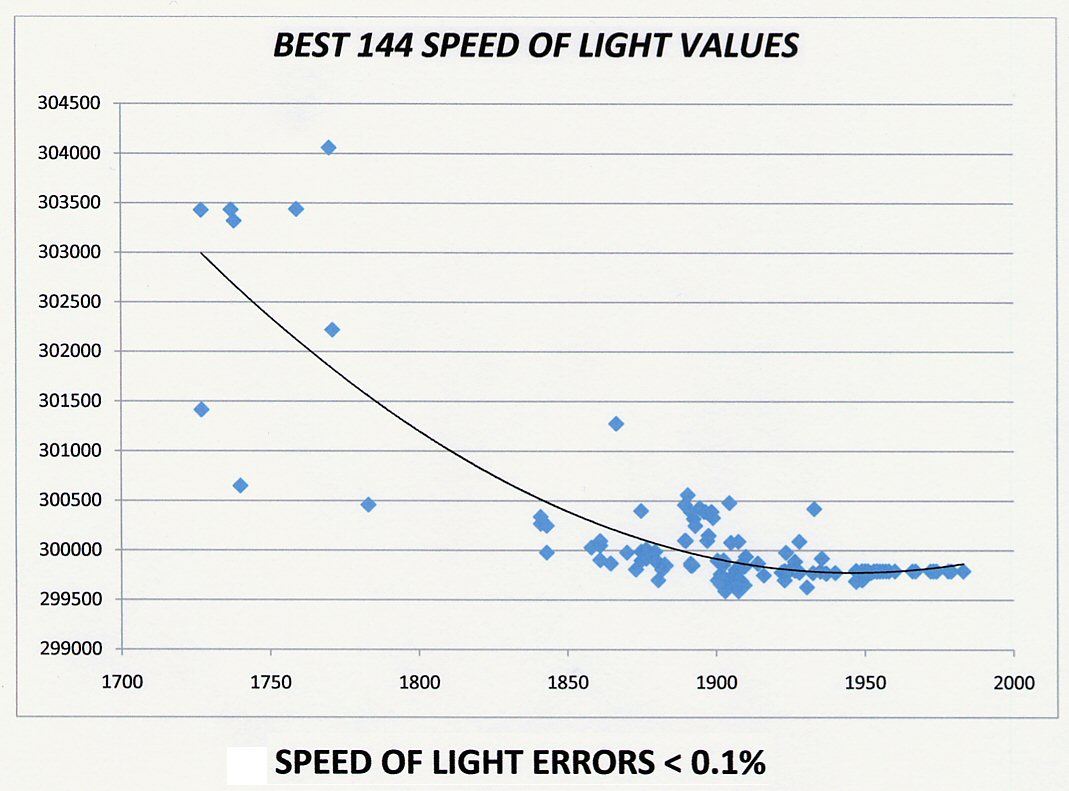
The conclusion here is that, in the early universe, when the ZPE strength was much lower, with far fewer virtual particles manifesting in the vacuum, the speed of light was correspondingly higher. Since the ZPE strength has increased by a factor of 11 billion since then, it follows that the speed of light back then, when the CMBR was formed, was therefore about 11 billion times its current speed. From this example, it may be stated that, generally, the speed of light at any designated redshift, z, will be close to (1 + z) 3 times the speed of light now, or “c,” which is defined as 299,792.458 km/s.
Given these figures, let us take one final piece of data that potentially answers the “horizon problem” for cosmologists. Simply stated, this problem exists because, by the consensus approach, distant regions of space in opposite directions of the sky are so far apart that, assuming standard Big Bang expansion, they could never have been in causal contact with each other. The CMB data added to the difficulty because we see uniformity in the CMB temperature across the entire sky, despite the entire sky not being in causal contact to establish thermal equilibrium to give that temperature.
To find a potential answer, we take the biblical information that the formation of the CMBR occurred when the light burst out at the 12 hour mark on the first day of Creation. Let us do a calculation based on a much lower ZPE and an inversely higher speed of light. Half a day is 1.3689 x 10⁻³ years. When this is multiplied by a factor of 11 billion for lightspeed, it emerges that in 12 hours, light would have travelled 15.05 million light years. Therefore, in half a day, every part of that early universe within a radius of 15 million light years had been in contact with each other. For this reason, the CMB could be smooth with a uniform temperature, provided we take this value of 15 million light years as the maximum radius of the universe at that time. Then, knowing that the redshift data shows there has been a linear increase in the radius of the universe by a factor of 2202 from then to now, we can calculate the current radius of the universe. Thus, 15.057 million light years multiplied by 2202 is 33.15 billion light years. This seems to be a reasonable approximation to the current accepted size of the observable cosmos, namely 46.5 billion light years.
Under these circumstances, four problems seem to have been solved. First, the horizon problem has basically disappeared. Second, the necessity for inflationary expansion and its attendant difficulties has been removed. Third, this approach suggests that the reason why there is no evidence of the influence of gravitational waves on the CMB is that the major expansion episode occurred after the CMB had formed, not before. This would be in line with bible indications. Then fourth, the problem no longer exists that some scholars have had in trying to get light back from the distant parts of the universe within a shorter time-frame than consensus science has proposed.
Barry Setterfield, 25th January 2023.
Postscript: 26 January 2033
Hi Friends!
In response to the "fragments" we have sent, Lambert wrote:
"Barry,
I am still intrigued by the claim of Dr. Ed Boudreaux that the most abundant element in the beginning was water.
“Water is probably the most remarkable substance known to man. Dr. Ed Boudreaux, a nuclear scientist, showed that all the elements of the periodic table could be generated in a matter of hours or days using H2O as a working substance, given temperatures and pressures thought to have existed during the six days of creation week.”
His work is little known!
Also, water is very unusual!"
Lambert
Barry replis:
WE HAVE NOT FORGOTTEN THESE FACTS!. ALLOW US TO REMIND YOU OF OUR SESSION ON "RECENT DEVELOPMENT: THE ORIGIN OF THE ELEMENTS" WHICH CAN BE FOUND HERE AND THE DISCOVERY WHICH PROMPTED ITS PRODUCTION!:
We will take opportunity to include this URL in the text of our "fragments" at an appropriate place. Many thanks for the necessary hint!
Blessings on you all,
Barry.
Comment from S. Douglas Woodward:
This is amazing work, and it is nice that it comes down to a few key numbers and points to remember (at least given the breadth of my understanding which is limited):
- Light moved 11 billion times faster when matter came into existence at the beginning of creation (at the conclusion of the first 12 hours). This was because ZPE had 11 billion fewer virtual particles than today. ZPE slows light in accordance with this factor. As ZPE increased (with expansion), the number of virtual particles increased by 11 billion times since the first day of creation.
- Light (no matter its strength) travels at the same speed across the cosmos. So light strength has nothing to do with the speed of light. ZPE is what gates the speed of light.
- Light would have traveled 15 million light-years in the first 12 hours. In those 12 hours, the entire universe had been touched. The radius of the Universe was 15 million light years at that moment.
- The redshift data suggests the universe has expanded by 2202 times. So 15 million times 2202 equals 33 billion light years, compared to academia’s estimate of 45 billion light years. Close enough.
- The CMB data is smooth because the temperature across the universe was consistent once atoms could spring from the ’nexus’ of ZPE. The ZPE is what holds the atoms together, making quanta stable.
- Gravity waves had no effect on the CMB since expansion occurred AFTER the CMB formed, not before.
<"center">Fragments No 2:
Continued from Fragments No. 1.
The Expansion of the Cosmos:
The CMB was formed as the original intensely hot plasma was cooled by universal expansion until neutral atoms formed. At that specific time, many of the isolated particles became part of atomic structures, effectively clearing the cosmic fog. This allowed light and radiation to pour out. However, after that event, the expansion continued and again the CMB provides evidence of what happened. But before we can address that data in detail, it should first be mentioned that current thinking in astronomy proposes a two-fold process. Cosmologist and particle physicist Professor Emeritus Ta-Pei Cheng of the University of Missouri summarizes both when he writes:
“The universe experienced a huge expansion in the earliest moments of the big bang. This cosmic inflationary epoch … left behind a universe that could be compatible with the observed matter and cosmic age if … the expansion of the universe is now accelerating.” (see Figure 8). Let us look at both these ideas individually.
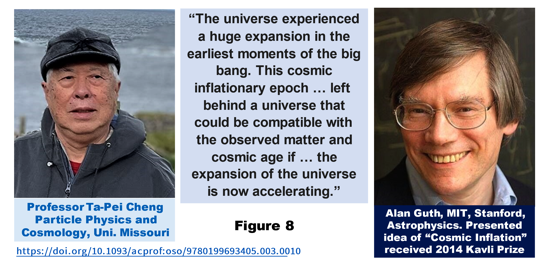
The first is that, immediately after the inception of the cosmos, an “inflationary phase” of incredibly rapid expansion began. This idea was presented by Alan Guth in 1979 to overcome some conceptual problems in astronomy. It was initially expected that this cosmic inflation would produce gravitational waves which would polarize the light coming from the CMB. Over the years, this idea has been verified mathematically by many, so the search for polarized light in the CMB from the gravitational ripples has been persistent. However, despite some false hopes initially, it had still not been found by 2022, For example, see the summary science article here: https://physics.aps.org/articles/v14/135
As a result of this lack of data, it may be permissible to speculate that perhaps we have got this the wrong way around. Perhaps the CMBR does not show the effects of inflationary expansion because such expansion did not occur before the formation of the CMBR. Perhaps it might have occurred afterwards. This may be more in line with the Biblical scenario in Genesis chapter one where the light shone out on Day one, with the resulting formation of the CMB. However, the inflationary phase of cosmic expansion seems to have begun after that event on Day 2 where the word translated “firmament” in Genesis 1:6 literally means “an expanse,” or “something that has been expanded out.”
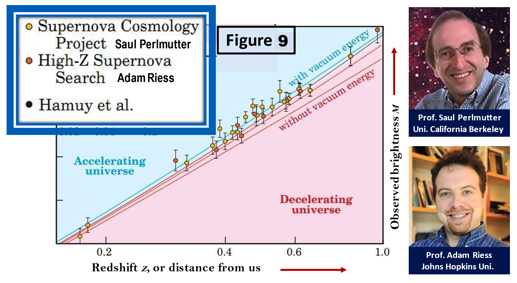
The second part of the process is that, following the era of inflationary expansion, the cosmos had then undergone accelerating expansion. This idea emerged in the period 1998 to 2001 from data collected by two separate teams; one, the Supernova Cosmology Project, was led by Saul Perlmutter, and the other, the High-Z Supernova Search Team, was led by Adam Riess. The controversial data came from a special type of exploding star, namely Type Ia supernovae. These stars were assumed to always have a standard brightness, like a light-bulb of known wattage. If their brightness was indeed fixed, like a standard headlight, these supernovae were fainter than expected. The conclusion was that this indicated they were farther away than anticipated. This, in turn, led to the conclusion that the universe must have expanded more rapidly than theorized. Both of those conclusions are entirely dependent on the initial assumption of a fixed brightness for the explosion. If some unknown factor interfered with that assumption in any way, then both the conclusions would have to be re-thought. Figure 9 plots the data which actually goes out to z = 1.2, where the quantity z is a measure of distance called the redshift. This will be discussed in detail later.
 Astronomers had hardly recovered from this surprise when a further shock came in 2001. Adam Riess had just examined the most distant Type Ia supernova yet found. It had a redshift of z = 1.7 and was not fainter, but brighter than expected. It was reported by Adam G. Riess and his team in the Astrophysical Journal 560 (2001), pp.49-71. If this result was accepted at face value it meant that the exploding star was closer to us than expected. This result was confirmed on 10 October 2003 when Riess announced that ten even more distant supernovas were all brighter than expected [see this URL: http://spaceflightnow.com/news/n0310/10expansion/
The explanation offered was that, in the early universe with a redshift greater than z = 1.6, expansion was indeed slowing under gravity. However, at about z = 1.6, the expansion of the universe started to accelerate. This idea of accelerated expansion was promoted soon afterwards. Both Perlmutter and Riess received the Nobel Prize for physics in 2011. The resulting standard model is now of an initial cosmic inflation epoch that was followed by period of expansion slowing under gravity, and then accelerating expansion, just as Professor Ta-Pei Cheng stated above. Yet if the basic assumption about the consistent brilliance of supernovas, or the cause of that brilliance, is called into doubt for whatever reason, then these conclusions would need to be re-thought. But even if all these difficulties were resolved so that the current consensus model is supported, there is a further serious problem.
Accounting for Inflation and Accelerated Expansion:
Both parts of this scenario, the initial era of cosmic inflation and the later period of accelerating expansion are physically very difficult to account for. There seems to be no physical reason for it to occur. However, years before, in 1915, Einstein had developed his equations to give a mathematical reason why the universe could be expanding, contracting, or static. To do this, he inserted a term, called the Cosmological Constant into his equations. As in Figure 10 below, his equations had the acceleration of the universe governed by gravity. Thus, if the universe started off expanding, gravity would slow it down and eventually cause it to stop, whereupon the cosmos would start to collapse. This was rather like a ball thrown into the air. Its ascent is slowed by gravity until it stops and then starts falling to earth. Mathematically, the Cosmological Constant was meant to act in the opposite way to gravity and cause the cosmos to expand. The gravitational terms (in the green box in Fig. 10) could then be balanced by the Cosmological Constant term (in the purple box on the right in Fig.10) to achieve the desired result for cosmic acceleration (blue box on extreme left in Fig. 10). So, this Cosmological Constant term could be inserted into the equation, as Einstein did initially, or dropped entirely (that is, made equal to zero) as Einstein ultimately did. In fact, he called the insertion of this term into his equations, his “greatest mistake.”
Figure 10: Einstein’s Equation showing how any cosmic acceleration (left box) is the result of the combined action of gravity (the terms in the green box), which slows down any initial expansion, and the action of “dark energy” described by the Cosmological Constant (purple box on the right), which speeds up the acceleration by forcing space to expand.
What is done with this term depends on what is being proposed scientifically. In the current scientific climate, it is proposed that the Cosmological Constant had a very high value initially and then it dropped to a small, but non-vanishing value to allow acceleration to occur. It has been difficult to account for why the value of the Cosmological Constant should change in the way that many cosmologists describe. The problem has recently become significantly worse. On 20th July 2020, a global team of astrophysicists released a study which suggested that, after the era of inflation, the cosmos continued to expand. However, when the universe was about half its present age, the expansion rate started to accelerate, and this has continued ever since. This proposal would require three different values for the Cosmological Constant to govern the three different expansion rates. The leader of the team admitted that “there is no concrete explanation yet as to why that is.” One press-release about the study is here: https://nationalpost.com/news/global-team-of-astrophysicists-release-largest-ever-3d-map-of-the-universe/wcm/6eba9010-2bb0-4340-8d9c-582a72c48273/
There are thus two distinct problems with any universal expansion being caused by the action of the Cosmological Constant. First, no-one knew initially what the physical mechanism was that this mathematical term was describing. It was then agreed that it is describing “dark energy” in the vacuum of space, and it is this energy which is forcing cosmic expansion. However, no-one knows the source of this dark energy or how it can force space to expand. We know that the action of gravity comes from the presence of matter. But the presence of matter seems unrelated to the action of the proposed dark energy. So there is not a parallel between dark matter and dark energy. As Science News Vol. 164:15 confirms, science is not sure of the source of dark energy. Furthermore, X-ray data from the European XMM satellite “leaves little room for dark energy” according to Alain Blanchard in a European Space Agency News Release 12 Dec. 2003. In 2019 & 2022, the origin of dark energy was still obscure and simply ascribed to the action of a Cosmological Constant [Dennis Overbye “Have dark forces been messing with the cosmos?” New York Times Feb. 25th, 2019; https://physicstoday.scitation.org/doi/10.1063/PT.3.2346 2022].
The second problem arises because of a huge discrepancy between what is expected theoretically and what is actually measured. For example, physicist Brian Greene in his award-winning book “The Elegant Universe,” page 225, writes: “…the cosmological constant can be interpreted as a kind of overall energy stored in the vacuum of space [a “dark energy”], and hence its value should be theoretically calculable and experimentally measurable. But to date, such calculations and measurements lead to a colossal mismatch: Observations show that the cosmological constant is either zero (as Einstein ultimately suggested) or quite small; [but] calculations indicate that quantum-mechanical fluctuations of the vacuum of empty space tend to generate a non-zero cosmological constant whose value is some 120 orders of magnitude larger than experiment allows!”
The same conclusion was reached by a different line of reasoning by Abbott. Furthermore, Barrow and Magueijo have also pointed out in the Astrophysical Journal Vol.532, page L87 that “If the cosmological constant is greater than zero, then cosmology faces a very serious fine-tuning problem …There is no theoretical motivation for a value of the cosmological constant of currently observable magnitude….” In a discussion on the subject in an article entitled “Vacuum Packed,” New Scientist for the 18th February, 2012, pp.34-37 and a paper by G.R. Bengochea et al in the European Physical Journal 80: (18) 1-12, reputable scientists reported very similar conclusions. Some physicists have described this problem as "the largest discrepancy between theory and experiment in all of science" or alternately "the worst theoretical prediction in the history of physics". What is the answer to all this?
Reassessing the Expansion of the Cosmos
With these comments and problems, it seems appropriate to step back and re-assess what is happening. The CMBR gives substantive evidence of an original intensely hot plasma that was cooled as the cosmos was expanded out. Physically and biblically, the evidence suggests the cosmos continued to expand after that CMBR event. However, it seems that the current interpretation of the data suggesting a period of accelerated expansion may be questioned. Indeed, ongoing discussions are taking place on a variety of potential problems with supernovae as standard headlights. Also, there have been developments in areas like plasma physics which offer explanations for the data which are different from the current consensus opinion. We therefore need some entirely independent method of determining what the behavior of the cosmos really has been. There are two methods that immediately come to mind. First there is the hydrogen cloud data, and second, there is the very recently determined data from the CMBR itself. Let us take them in that order.
Hydrogen Cloud Data
Hydrogen clouds are distributed throughout the universe. As light from a more distant source passes through each successive hydrogen cloud in its path, a selective wavelength is absorbed by the hydrogen atoms. Each time it happens, the absorption of light at a selective wavelength produces a dark line on the rainbow spectrum of the light coming through the cloud on its way to us. The dark line of importance from hydrogen is called the Lyman Alpha line. As the light from a brilliant, but distant source goes through more and more hydrogen clouds on its journey to us, an increasing number of Lyman Alpha lines are built up on the spectrum. It is important to note an astronomical effect here. The farther away an astronomical object is, the further towards the red end of the rainbow spectrum its light is shifted. This effect is called the redshift and is designated by the letter z. Thus, the greater the distance from us, the higher will be the value of z. We will look at this in detail a bit later.
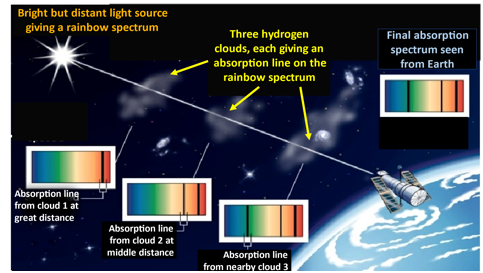
Figure 11: See description in the text.
Crucially, it must be noted that this effect also applies to the wavelength of light that the hydrogen clouds absorb. The farther away from us those clouds are, the further down towards the red end of the spectrum the dark Lyman Alpha absorption line occurs. That means the position of the Lyman Alpha line on the color spectrum from an individual cloud will be dependent on its distance or redshift. The situation is diagrammed in Figure 11 for three hydrogen clouds, of great, medium and nearby distances. The most distant cloud will leave its dark absorption line in the red end of the spectrum. The second cloud at a middle distance will leave its dark line more towards the yellow region of the spectrum. Finally, the 3rd cloud, which is relatively nearby, will leave its dark line near the blue region of the spectrum. The final outcome is a rainbow spectrum with three dark lines, one in the red, one in the yellow, and one in the blue part respectively as shown by the spectrum in the top right.
As a result of traveling great astronomical distances, light passing through a large number of these clouds at different distances will arrive at earth with a whole suite of lines. This is referred to as the 'Lyman Alpha forest.' Analysis indicates that, if the universe is continuing to expand, the average distance between the hydrogen clouds should be increasing as we come forward in time (which means closer to our own galaxy, since the farther out we look, the further back in time we are seeing). This means that as we look back into the past, and hence to greater redshifts, the clouds should be closer together. However, if the universe is relatively static, the average distance between the clouds should remain more or less fixed. An example of what we do see is given in Figure 12, where the Lyman Alpha forest is documented for increasing redshifts from top to bottom. Inspection reveals that the forest becomes thicker with higher redshifts, z. When we recall that each line comes from a hydrogen cloud, Figure 12 gives some of the evidence that those clouds were closer together in the early universe and then became progressively farther apart. This supports the idea of cosmic expansion.
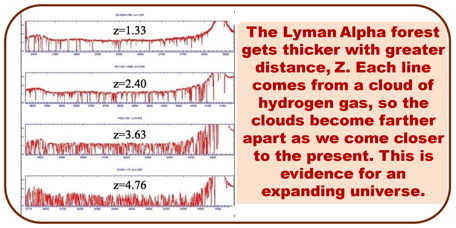
Figure 12: Hydrogen clouds leave a characteristic line (the Lyman Alpha line) on the rainbow spectrum. Each cloud that the light from a distant source passes through leaves a single line. The more hydrogen clouds, the more of these lines that make up the Lyman Alpha forest. The evidence from these lines is that the greater the distance (given by the quantity z), the more the clouds are crowded together. This is evidence for an expanding universe.
A detailed study of this matter has been performed by Lyndon Ashmore, among others. The Abstract to one of his papers contains these conclusions:
"This paper examines the Lyman Alpha forest in order to determine the average temperature and the average separation of Hydrogen clouds over the aging of the universe. A review of the literature shows that the clouds did once become further and further apart (showing expansion?) but are now evenly spaced (an indication of a static universe?). ... Whilst these results do not support any cosmology individually, they do support one where the universe expanded in the past but that expansion has now been arrested and the universe is now static". [L Ashmore, 2nd Crisis in Cosmology Conference, CCC-2. ASP Conference Series, Vol. 413, Proceedings of the Conference held 7-11 September 2008, at Port Angeles, Washington, USA. F. Potter, ed., p.3 (Astronomical Society of the Pacific, San Francisco, 2009)].
So, while the standard model states that the universe expanded out rapidly and that this expansion is continuing, the hydrogen cloud data indicate that the universe underwent initial expansion out to about a redshift of about z = 2.6 and then started to slow down. Somewhere in the interval of a redshift from about z = 1.6 down to z = 1.0 the hydrogen cloud data suggest the cosmos became static. An interesting circumstance may be commented on here. The supernova data showed something actually changed with regard to expansion rates in the interval of redshifts from z = 1.7 down to about z = 1.5. This is in remarkable accord with the hydrogen cloud data. The question is now more emphatic: “What happened?” This data set is also in complete accord with an entirely different line of enquiry with different evidence from the CMBR itself. Let us now look at that.
Fragments no 3 (Continued from Fragments No. 2)
The CMBR Temperature and Universal Expansion.
The CMB itself gives us information about universal expansion because the temperature of the CMBR drops as the cosmos expands. The current CMB temperature is 2.7259 K. According to standard theory, when the universe was half its present size, the CMB temperature was twice its present value at 5.452 degrees K. When the cosmos was one-hundredth of its present size, the CMB temperature was 100 times its present value at 273 degrees K or 32 degrees F (the freezing point of water, or 0 C.). In addition, it is currently suggested that the CMB temperature is linearly dependent upon the redshift, z. Thus, as we look back in time to higher redshifts, the CMB temperature should become higher in proportion. Therefore, the behavior of the universe can be traced by a study of the CMB temperatures at a variety of redshifts.
These data can be obtained by several methods. The first method relies on the fact that, within clusters of galaxies, a number of energetic free electrons exist with a known energy distribution. When a CMB photon interacts with one of these electrons, it induces a distortion of the CMB spectrum. This distortion from the true spectrum allows a measurement of the CMB temperature at the cluster to be measured. One limitation of the method is that appropriate clusters are hard to find at redshifts greater than about z =1. Nevertheless, a direct measure of the CMB temperature at the redshift of the galaxy cluster can be obtained this way.|
The second method, which has been used up to a redshift of z = 3.3, is based on the absorption lines in the rainbow spectrum of quasars as electrons jump or transition from one atomic orbit to another. The relevant absorption lines in this case come from those specific atomic and molecular energy levels in which electrons are elevated to higher orbits by the Cosmic Background radiation. The absorption lines which are commonly employed are those from carbon monoxide which occur in the ultra-violet region. However, other wavelengths have also been used with different molecules, some in the radio to millimeter region of the spectrum. This method provides a direct measure of the CMB temperature as well.
The third method was only developed in 2022, but allows CMB temperature measurements out to the most distant redshifts. It uses the absorption line from a specific type of water molecule on the CMB spectrum. The characteristics of the absorption feature depend only on CMB temperature. (D. A. Riechers et al., Nature 602, 58, 2022.).
The data accumulated by all three methods are listed in Table 1 & presented graphically in Figure 13.
TABLE 1: Measured CMB Temperature, in degrees K, with increasing redshift, z.
Table of CMB Temperature and Redshift: 2002 Data by Battistelli et al. marked* The Astrophysical Journal, 580:L101-L104, 2002 December 1. 2009 Data by Luzzi et al, marked ** Astrophysical Journal, Volume 705;1122, 2009. 2013 Data by Hurier et al. marked # note redshift here is the midpoint in a range of z = ( +/- 0.025) of galaxies studied Astronomy & Astrophysics 561, A143 (2014).. 2020 Unmarked data collated by Klimenko et al. Astronomy Letters, Volume 46, Issue 11, p.715-725, 2020. 2022 Data by Riechers et al, marked + Nature 602, 58, 2022. The datum for z = 0.000 (now) comes from Fixsen 2009 – Astrophysical Journal 707 (2) 916-920, 2009. The groups of data in red or green have been averaged with the final result of that group marked as “Av” with a * at both ends of the result. These are the values plotted instead of all the individual values. The data in blue are isolated values which have also been plotted in Figure 13 below.
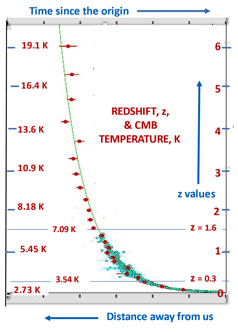
Figure 13:
From averaging the data in Table 1, analysis indicates that, at a redshift of z = 1, the CMB temperature was close to T1 = 5.813 degrees K as recorded. Let us accept the current CMB temperature right now (at a redshift of z = 0) as T0 = 2.725K. If there is a parallel relationship between the redshift and CMB temperature, then there will be a corresponding formulation between specific emitted wavelengths and CMB temperatures. Therefore, just as the wavelength, W’, of a specific line in the rainbow spectrum compared with the laboratory standard, W0 , gives us the following redshift
W1 / W0 = (1 + z) ….(1)
Then we might expect that the temperature T1 of the CMB at a given distance compared with T0 now will have the parallel form
T1 / T0 = (1 + z) ,,,,(2)
We can thus predict from (2) that, at a given distance, the CMB temperature T1 should be given by
T1 = T0 (1 + z) ,,,.(3)
In the case at z = 1, the measured value for T1 was about 5.813 K. Our predictive relationship suggests that, if CMB temperatures are tracking in the same way as the redshift relationship, then from (3) we have T1 should be 2.725 ( 1 + 1) = 5.45 K. This is within the error limits of the data.
At the highest redshift for which a reading of CMB temperature has been taken, namely z = 6.34+, we expect a minimum value of 2.725 (1 + 6.34+) = 20.00+ degrees K. The actual data was 23.3 K, but the difference from that predicted was well within the error limits, and there is good possibility that the actual redshift, z, was higher.
The other CMB temperature values plotted on Figure 13 are in similar accord with this expectation of a linear relationship with redshift. The expected CMB temperatures are listed opposite the unit values of z on the vertical axes of the graph. Thus, the linear relationship of CMB temperature with redshift and expansion is maintained out to large redshifts. The greatest value of redshift recently confirmed from the Webb space telescope is z = 13.2. This is stated as being only 330 million years from the inception of the cosmos.
How Has the Universe Behaved?
The graph in Figure 13 confirms the relationship between redshift and CMB temperature on the vertical axis. The same is true for the horizontal axis which gives the distance away from us, or, alternately, the time since the origin since distance and time are related. This graph also shows how the cosmos has behaved. The first feature that draws attention is the dramatic and almost linear vertical drop from the top left, with a redshift, z, from over 6, down to about z = 1.6. Second, near about z = 1.6, the almost linear vertical drop becomes a curve gradually changing its slope down to about z = 0.3. Third, below about z = 0.3, the curve has flattened out to one which is essentially linear, but almost horizontal, tapering down to its present value. All this is accompanied by similar changes in CMB temperature, which confirm the overall picture.
However, another item to note here is the time and distance intervals over which these three segments of the curve occur. These intervals on the horizontal axis indicate that the initial steep drop basically occurred over a time covered by just one and a half of the 5 segments making up this axis. This shows that the major part of the temperature drop (from its initial very high value, and the accompanying drop from a very high redshift, z), occurred quickly on a cosmological time-scale. Since the CMB temperature data and the redshift are both uniformly affected, it indicates that there was a rapid increase in the size of the cosmos down to a redshift of about z = 1.6. This accords with the hydrogen cloud data.
The second point to notice is that from a redshift of about z = 1.6 down to about z = 0.3, there is a tapering off of the expansion rate. The overall change in redshift is just over one unit and about 3 degrees K or so in the CMB temperature. On the horizontal axis, this covers about one unit out of the five. All this shows the expansion rate is slowing down, not accelerating.
Finally, from about z = 0.3 down to z = 0, and a temperature drop of about half a degree K, the curve tends towards the horizontal as it tapers down to its present value in a linear fashion. Note that this takes just over two of the time and distance segments out of the five, which is longer than the vertical drop. Although the initial drop points to a rapid cosmic expansion, the tail on the curve from z = 0.3 does not seem to support accelerating expansion. The initial massive drop in redshift values and the CMB temperature speaks of a massive increase in the size of the universe to begin. In contrast, the very small change in redshift values and CMB temperatures over the last part of the curve suggests very small changes in the size of the cosmos by comparison with what had occurred earlier. This approach based on CMB temperature data and redshift therefore seems more in accord with the hydrogen cloud observations than the concept of accelerating expansion. ||
Seeking a Solution…
The implication from all this is that a significant change occurred in cosmic behavior, or expansion, of the universe somewhere near a redshift of z = 1. 6. This change is reflected in the shape of the redshift/distance curve at that point and supported by the CMB temperature data. It is at this same point that something seems to happen to our “standard headlights” used for measuring distance. There seem to be three options, all linked somehow with universal expansion. First, if we assume the brightness of these ‘headlights’ is indeed correct, then something has happened to their expected distance. Second, we might alternately postulate that there has been a change in the behavior of the supernovae and/or their brightness for some reason. Third, the brightness, redshift, and temperature data may all be due to some common, overarching cause. This cause may be something like a change in the electro-magnetic properties of the vacuum, which are somehow linked with cosmic expansion.
If we follow this last thought for a moment, outrageous as it may seem, we note that it has at least a possibility of influencing the brightness of some objects as in the first and second options. It also holds the potential to control the redshift of light at the time of emission, instead of it being changed in transit as is currently assumed. This assumption itself results in a number of problems to be outlined later. Yet it was in the context of some additional problems emerging because of the suspected quantization of the redshift, that a key suggestion was made. Dr. John Gribbin, an editor of New Scientist, mentioned on 20th June, 1985, that many redshift problems may all be resolved if the redshift of light from stars and galaxies was caused, not by something happening to light in transit, but rather was due to the intrinsic behavior of atomic emitters themselves within those stars and galaxies. If that really is what is happening, then exploration of that option opens up a whole new scenario. In that context, the following approach might be considered. In doing so, we need to establish some introductory concepts before the needed answers can emerge.
A Potential Answer?
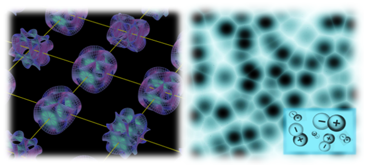
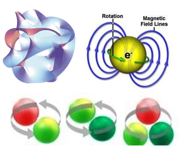
The foregoing discussion has confirmed the expansion of the cosmos or the stretching the heavens. It might be considered to be rather like inflating a balloon, or stretching a rubber band. This process puts energy into the fabric of the balloon or rubber band. In a similar manner, stretching the heavens resulted in a tension or force or energy being manifest in what is referred to as “the fabric of space.” This description hints that some sort of ‘structure’ to the vacuum exists, like the weave in the fabric of a cloth. The fabric of space is considered by some scientists to be made up of a “weave” of extra dimensions rolled up into ball-like Calabi-Yau shapes, as shown on the left in Figure 14. In the right hand panel of Figure 14, the top left image shows a Calabi-Yau shape in more detail. However, others consider the weave to be made up of spinning, but oppositely charged, particle pairs with intrinsic electric and magnetic fields as depicted in the middle in Figure 14. The inset at bottom of this panel shows the oppositely charged particle pairs. However, because they are also spinning and moving, the associated magnetic fields occur. These particles are the smallest that can exist in this universe. The right hand panel in Figure 14 shows, on the top right, such a particle in more detail, while the bottom sector depicts such particles moving around each other. Magnetic fields result from all this movement.
When the cosmos was first formed, these shapes or particles were very close together. Then, as the stretching went on, these shapes became farther and farther apart. Today it is considered that their separation is of the order of 10^-33 centimeters. This is called the Planck length, and the particles are called Planck particles. In a similar way that inflating a balloon invested energy into the balloon’s fabric, this cosmological stretching or expansion process put an electromagnetic energy into the fabric of space in a way we will explain in more detail in a moment. In other words, during expansion, energy was being invested into the fabric of space at its most basic level.
Figure 14: Two options being considered for the “fabric of space.” Left: Rolled up extra dimensions called “Calabi-Yau shapes”. Middle: Spinning, oppositely charged particle pairs with intrinsic electric and magnetic fields. These are called “Planck Particles.” Right: enlargements of a Calabi-Yau shape in top left; enlargement of a spinning, charged Planck Particle with its magnetic field; bottom depicts spinning Planck Particles moving around each other. For these options, the particles are of the order of 10^-33 centimeters in size, the Planck Length, the scale at which space breaks up. Experiments have shown space is smooth down to a level of 10^13.2 times greater than the Planck Length.
This energy has been shown to be there experimentally, even at zero degrees Kelvin, that is absolute zero. For this reason, it is called the Zero Point Energy or ZPE. Because of its mode of formation, the ZPE strength is expected to be uniform throughout the whole cosmos at any given instant, even though it has systematically increased with time as expansion continued. Some important discoveries about the Zero Point Energy have been made by a branch of physics which developed after Louis de Broglie wrote his book “New Perspectives in Physics” in 1962. It is called SED physics, or Stochastic Electro-Dynamics, because of the importance of the random or stochastic waves of the ZPE in physical phenomena.
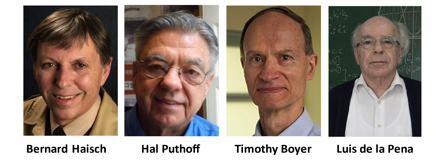
Figure 15: Data for SED/ZPE physics come from many peer-reviewed papers by key physicists such as B. Haisch, H. Puthoff, T. Boyer, L.de la Pena, their associates and many others.
 >
In contrast to quantum physics, SED physics considers the ZPE to be a real physical quantity, not just a virtual entity or mathematical abstraction. SED physicists point out that it is the impacts of the ZPE waves on sub-atomic particles which gives them a random (or stochastic) jitter and causes quantum uncertainty. The degree of uncertainty can be appreciated by the fact that there are about 10^20 hits per second by ZPE waves on subatomic particles. This is called the Compton frequency. It follows, then, that without the ZPE there would be no quantum uncertainty. Some of the conclusions of SED physicists about ZPE effects and the astronomical results can be found in the Monograph “Cosmology and the Zero Point Energy,” (and many references therein), which was distributed as part of the 20th Annual NPA Conference, College Park, Maryland, in July 2013.
>
In contrast to quantum physics, SED physics considers the ZPE to be a real physical quantity, not just a virtual entity or mathematical abstraction. SED physicists point out that it is the impacts of the ZPE waves on sub-atomic particles which gives them a random (or stochastic) jitter and causes quantum uncertainty. The degree of uncertainty can be appreciated by the fact that there are about 10^20 hits per second by ZPE waves on subatomic particles. This is called the Compton frequency. It follows, then, that without the ZPE there would be no quantum uncertainty. Some of the conclusions of SED physicists about ZPE effects and the astronomical results can be found in the Monograph “Cosmology and the Zero Point Energy,” (and many references therein), which was distributed as part of the 20th Annual NPA Conference, College Park, Maryland, in July 2013.
What happened with cosmic expansion:
We now need to see how the enormous tensional energy in the fabric of space, generated by the expansion, would result in the formation of particle-antiparticle pairs and the ZPE. This is quite apart from the initially enormous temperatures which also had a role in their formation.
Since the SED approach to physics states that all quantum uncertainty is the result of the action of the Zero Point Energy, it therefore follows that, initially, with no ZPE, there was also no quantum uncertainty. This means that the Planck Particle Pairs were definitely a real, not just a virtual, entity. It is thought by many scientists that the fabric of space was initially made up of a lattice-work or weave of these particles, as in Figure 14. However, it goes much further. Using two different approaches, C.H. Gibson, [36], and then Hoyle, Burbidge and Narlikar, [37], have shown that the cosmic expansion process would result in the formation of cascades of many more of these tiny Planck Particle Pairs (PPP). [C H Gibson, “Turbulence and Mixing in the Early Universe”, Keynote Paper, International Conference Mechanical Engineering, Dhaka, Bangladesh, Dec. 26-28, 2001, http://arxiv.org/ abs/astro-ph/0110012 (Retrieved 15th January, 2023). F. Hoyle, G. Burbidge & J. Narlikar, A Different Approach to Cosmology, pp.108 ff. (Cambridge University Press, Cambridge, UK, 2005). ]
Whichever model is chosen, there is also agreement that ongoing universal expansion would feed energy into the system and cause massive turbulence among the PPP. Gibson points out that this turbulence then produced more Planck Particle Pairs with their electric and magnetic properties. This violent turbulence would have ensured separation of the Planck Particle Pairs. The separation of the intrinsic electric charges among the PPP would produce more electric fields, while their turbulent movement would also produce additional magnetic fields. Further, the turbulent gyrations of the PPP themselves would radiate electromagnetic energy into their environment. These were the origins of the initial electric and magnetic fields of the ZPE, which controls the electromagnetic properties of the vacuum.
The data graph and the evidence from hydrogen clouds suggest that the force driving the expansion had ceased to operate about z = 1.6. For some time after that the expansion would coast to a stop. It is at this point that Gibson’s analysis again becomes helpful. He noted that if universal expansion (or initial inflation) ceased, the vortices and turbulence that had been generated up to that point would continue to persist until all the turbulent energy had been converted to Planck Particle Pairs. Because of the inelasticity and size of the system, the persistence and decay phases of turbulence probably took a comparatively long time. Atmospheric turbulence shows a similar behavior (see figure 16).
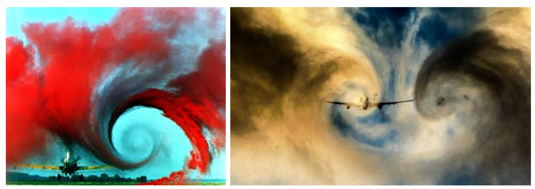
Figure 16: Turbulence from light aircraft (L) and from large aircraft (R). Because of the long persistence and decay time for turbulence, it was considered unsafe to land other aircraft behind a Boeing 777 until 5 to 7 minutes had elapsed after its touchdown - otherwise the following planes could be overturned or damaged. Similar dangers existed in flight paths following such aircraft.
During this time for the persistence and decay of the PPP turbulence, the ZPE strength would have continued to increase, since PPP numbers were also building, but in a tapering fashion because the driving force was no longer in operation. Since these processes were slowing and gradually coming to a stop, that part of the graph follows a typical decay pattern and starts to taper off. At a value of about z = 0.3, turbulence among the PPP’s was probably getting close to dying out.
Once expansion had ceased and turbulence subsequently died out, the Planck Particle Pairs would have continued to recombine for some time. When PPP recombine, they annihilate, and their total energy is converted to electromagnetic radiation, which further built up the Zero Point Energy. Thus the electro-magnetic fields and waves of the ZPE would continue to build up, even after the turbulence ceased, until all PPP had recombined. We know from our lab experiments that the recombination phase is often a linear process. Therefore, as the recombination of the PPP’s went to completion, the final phase of the data curve is a linear pattern down to z = 0. After that point, the ZPE strength would be maintained by the “self-regenerating cosmological feedback cycle” as outlined by Puthoff and other SED physicists in this reference [H.E Puthoff, ‘Source of Vacuum Electromagnetic Zero-Point Energy,’ Physical Review A 40:9, pp. 4857-4862 (1989).]
.
However, there is one final aspect to the behavior of the universe. The universe had now attained its maximum size and the ZPE had attained its maximum value and was being maintained by the feedback cycle. In March 1993, the astronomers Narlikar and Arp demonstrated in the Astrophysical Journal, 405:1, pp.51-56, that such a universe would be stable against collapse if it oscillated slightly. This meant that the strength of the ZPE would similarly oscillate, but in an inverse fashion. When the cosmos was at its maximum extended size, the fixed quantity of the ZPE would be in a larger volume than average and so appear to have a lower strength. Conversely, when the cosmos was at its minimum size, the same amount of ZPE was in a smaller volume, so its strength would appear greater than average.
Because the universe may be oscillating in several modes simultaneously, the variation in ZPE strength may not be simple, but rather follow a more complex curve similar to that in Figure 18. In this example, two different modes of oscillation (red and blue curves) combine to give an overall result shown by the teal-colored curve which contains a “flat point.” There is evidence for just such behavior over time in a number of physical quantities which are ZPE dependent. This is outlined in much more detail in the article at this URL: https://www.barrysetterfield.org/Pyramids/text.html However, to appreciate how this can be so, we need to examine the role played by the ZPE in atomic phenomena. Again, our main aim is to explain the data related to the CMB, the ZPE and cosmological expansion.
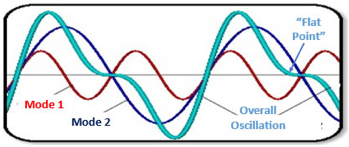
Figure 17: Adding modes of oscillation to get a final curve
This paper is continued in: Fragments no 4
FRAGMENTS NO. 4
Continued from Fragments No. 3
The Importance of the ZPE
A major breakthrough in the understanding of the importance of the ZPE occurred in 1987 with the work of Hal Puthoff and other scientists in the SED group. In a number of papers published in major scientific journals, they demonstrated that the all-pervasive ZPE ‘sea” was responsible for maintaining the stability of all atomic orbits. According to the SED approach, classical physics is correct in considering the electron to be radiating energy as it orbits the nucleus of an atom, but this must be coupled with the effects of the ZPE. The energy that electrons radiate can be calculated, along with the energy that these electrons absorb from the ZPE.
Puthoff found that, for stable orbits, the energy lost by radiation was equal to the energy gained from the ZPE. In his conclusion, he states that: “aprecise quantitative argument can be made that the ground state of the hydrogen atom is defined by a dynamic equilibrium in which the collapse of the state is prevented by the presence of the zero-point fluctuations of the electromagnetic field.” Other researchers like de la Pena summarized the situation by saying “if one considers circular orbits only, then one obtains an equilibrium [orbit] radius of the expected size [the Bohr radius]: for smaller distances, the electron absorbs too much energy from the [ZPE] field…and tends to escape, whereas for larger distances it radiates too much and tends to fall towards the nucleus.” [H. E. Puthoff, ‘Ground state of hydrogen as a zero-point fluctuation determined state’, Physical Review D, 35:10 (1987) 3266-3269. L. de la Pena, ‘Stochastic Electrodynamics: Its Development, Present Situation, And Perspectives,’ in Stochastic Processes Applied to Physics and other Related Fields, B. Gomez et al. eds., (World Scientific Publishing Co. Pty. Ltd, pp. 428-581, 1983)].
In this way, the very existence of atomic structures depends on this ZPE ‘sea’. Without it, all matter in the cosmos would disrupt. New Scientist discussed this in July 1987 and July 1990 under the heading “Why atoms don’t collapse.” Atomic orbit energies are therefore sustained by the Zero Point Energy
This is almost a quote from the Bible in Hebrews 1:3 and Colossians 1:17 where we are told that the Lord upholds all created things by the word of His own power, so that by this power everything holds together.
The Cosmic Background Radiation & ZPE Again:
These considerations have important consequences astronomically in the context of this discussion. For example, there is a hidden implication in the above conclusions about the ZPE and atoms. If the strength of the ZPE determines the energy and stability of atomic orbits, this means that, until the ZPE had built up sufficiently, no atomic orbits were stable. This in turn means that until the ZPE strength had reached a certain threshold, it was impossible for neutral atoms to form. In other words, even if the temperature of the universe had dropped to a low enough level with cosmic expansion, it would not be possible to form neutral atoms until the ZPE strength was high enough. Therefore, since the CMB can only form when neutral atoms are possible, then the moment of formation of the CMB was determined more by the ZPE strength than it was by the cosmic temperature. This could mean that at one instant the whole universe is a plasma fog trapping in radiation, but a few seconds later, as the ZPE strength crossed the threshold, the trapped light and radiation would stream out as the whole universe suddenly became instantly transparent. That was the moment when the first atoms were formed.
This brings in the attendant question of what the cosmic temperature was likely to be when the CMB formed. We get some idea of this from the fact that the two dominant elements in the universe are hydrogen (73%) and helium (25%). All the rest only form 2% of the matter in the universe. Laboratory experiments with cooling a high temperature plasma (ions) show that neutral atoms of helium start forming at temperature around 12,000 K. As hydrogen is heated in the lab, ionization has just started at 5800 K. In the reverse process, namely cooling from a high temperature plasma, neutral atoms start forming from hydrogen ions at 6500 K. The Saha equation usually gives this as the ionization temperature for hydrogen. Cosmologists impose special conditions for the CMB to occur and suggest a temperature as low as 3000 degrees K for it to form from hydrogen. Without these special conditions, both hydrogen and helium will exist as neutral atoms at a temperature near 6000 K. This temperature will allow CMB formation once the ZPE has built sufficiently to form neutral atoms.
We can go further. We have noted that, as the distance between any two points in the cosmos doubles with expansion, the temperature halves. Therefore, since CMB temperature and redshift are related, then the ratios of the CMB temperature at its formation compared with now will give us the redshift, (1 + z), at the time of formation. Thus 6000K / 2.725K = 2202 = (1 + z). This also reveals that the distance apart of any two points in the cosmos has increased linearly by a factor of 2202 since the formation of the CMBR up until the present. This has implications as far as the Zero Point Energy is concerned. This energy arises from the force or tension operating in the “lattice-work” or “fabric” that is the structure of the vacuum, as noted above. This lattice-work is not just linear, but exists in 3-dimensions. As a result, the ZPE is generated by the stretching in 3 dimensions. Consequently, the ZPE has increased by a factor of (2202)3 = 1.0677 x 10¹⁰ or about 11 billion since the CMB formed.
This figure is confirmed by an entirely separate line of thinking. According to SED physics, the number of hits by ZPE waves on the electron per second causing its “jitter-motion” (or zitterbewegung to use the technical term), is given by the Compton frequency, C*. This is equal to 1.2356 x 10²⁰ per second. In their analysis, Spicka et al, use Lamour’s formula as a starting point to examine the power lost by an electron going around the nucleus as a result of recoil radiation from ZPE impacts and the power gained from the ZPE. One key component in their analysis is the mean free path, λ, of the electron between these collisions. In previous work, data throughout the cosmos was examined, and it was concluded that the quantity (e2 / ε) is constant throughout the universe with all changes in the ZPE (where e is the electronic charge and ε is the electric permittivity of space). [See NPA Monograph No.1, July 2013, “Cosmology and the Zero Point Energy”, chapter 2]. Given the constancy of the quantity (e2 / ε), the equations from Spicka’s analysis show that the quantity (h2 λ) is also a constant, where “h” is Planck’s constant. SED physics points out that Planck’s second paper of 1911 shows that h is proportional to the strength of the ZPE. Thus, since h2 is proportional to 1/ λ , then h is proportional to √(1/ λ ) for the electron. Since λ, the mean free path, is inversely related to the number of hits per second, given by the Compton frequency, C*, then the ZPE strength is also proportional to (√ C*). This also follows from Einstein’s theory of Brownian movement where he argued that the mean square displacement was dependent on the square root of the frequency. [see Einstein, Albert (1956) [1926]. Investigations on the Theory of the Brownian Movement (PDF). Dover Publications. ]
From these concepts we can construct the following equations in which the symbol ~ is taken to mean “proportional to” in this presentation. Thus we have:
h ~ 1/ (√λ) ~ √ C* ….(4)
It can also be shown that the relationship between the mean free path and the Compton frequency can be written
λ = k / (1 + C*) ….(5)
where k is a constant of proportionality. Therefore, from (4) and (5) we can write:
hn / h0 = √ (λ0 / λn ) = √ [(1 + C*n) / (1 + C*0)] ….(6)
where the subscript 0 stands for the value of the quantity at the time of the CMB emission and the subscript n stands for the value of the quantity right now and k cancels out. Finally, since the ZPE built up from nothing to its present level by cosmic expansion, then we can put C*0 = 0 in (6) with the result that
hn / h0/ = √ (λ0 / λn ) = √ [(1 + C*n ) / (1 + 0 )] = √ (1 + C*n ) = (1 + 1.2356 x 10²⁰) = 1.11 x 10¹⁰ …. (7)
The Compton frequency therefore bears testimony to the fact that the ZPE has increased by a factor of about 1.1 x 10¹⁰ since the CMB formed with the first atoms.
The CMB and ZPE May Answer Some Big Questions:
The information that the ZPE has increased by a factor of about 10.6 billion since the CMB formation holds the potential to resolve a persistent problem for cosmologists. This ZPE factor means that the electromagnetic properties of the vacuum have been altered considerably since the CMB was formed. According to SED physics, these ZPE electromagnetic waves are like waves on the ocean that meet, crest, peak and form whitecaps and then disappear. However, in the ZPE case, when the waves meet, there is a concentration of energy which allows the formation of virtual particle pairs like an electron-positron pair, or a proton-anti-proton pair or a positive and negative pion. Science has recognized at least 21 different types of such virtual particle pairs, which appear momentarily in the vacuum and then smash together and annihilate, going back to energy. The intense number of such particles appearing and disappearing every moment in a very small volume have caused some physicists to call it “the seething vacuum.” As cosmic expansion continued, the ZPE increased. Space then got “thicker” with energy & virtual particles. Originally, at the time of CMB formation, there would have been very few of these particles.
The importance of this emerged from the studies of Marcel Urban and a team of French astrophysicists from the University of Paris published in The European Physical Journal D for 16th January 2013. It had been pointed out that a photon of light in transit through the vacuum will be absorbed by such particles. A moment later, the particle pair annihilates, the photon re-emitted and goes on its way…only to be absorbed by another virtual particle and, a few moments later, be re-emitted. Each such interaction takes a brief but finite time. Marcel Urban and his team were able to reproduce the current speed of light from the interaction times of photons with virtual particles in the vacuum. Later this was verified in a way that is controversial, Special cameras can take images at 10 trillion frames per second. Using this camera on 27th March, 2019 to photograph a pulse of light going through a bottle it was found that the progression of the photon went in a series of jerks between pauses. It seems that they may have photographed the photon’s interaction with virtual particles at the pauses and its rapid travel between them. Marcel Urban’s team found the interaction times were independent of photon energies. In other words, it didn’t matter what color the light was, or how energetic the photon was, the interaction time of light photons with the virtual particles was the same.
The conclusion here is that, in the early universe, when the ZPE strength was much lower, with far fewer virtual particles manifesting in the vacuum, the speed of light was correspondingly higher. Since the ZPE strength has increased by a factor of 10.6 billion since then, it follows that the speed of light back then, when the CMBR was formed, was therefore 10.6 billion times its current speed. From this example, it may be stated that, generally, the speed of light at any designated redshift, z, will be close to (1 + z) 3 times the speed of light now, or “c,” which is defined as 299,792.458 km/s.
Given these figures, let us take one final piece of data that potentially answers the “horizon problem” for cosmologists. Simply stated, this problem exists because, by the consensus approach, distant regions of space in opposite directions of the sky are so far apart that, assuming standard Big Bang expansion, they could never have been in causal contact with each other. The CMB data added to the difficulty because we see uniformity in the CMB temperature across the entire sky, despite the entire sky not being in causal contact to establish thermal equilibrium to give that temperature.
To find a potential answer, we take the biblical information that the formation of the CMBR occurred when the light burst out at the 12 hour mark on the first day of Creation. Let us do a calculation based on a much lower ZPE and an inversely higher speed of light. Half a day is 1.3689 x 10⁻³ years. When this is multiplied by a factor of 10.6 billion for lightspeed, it emerges that in 12 hours, light would have travelled 14.61 million light years. Therefore, in half a day, every part of that early universe within a radius of 14.61 million light years had been in contact with each other. For this reason, the CMB could be smooth with a uniform temperature, provided we take this value of 14.61 million light years as the maximum radius of the universe at that time. Then, knowing that the redshift data shows there has been a linear increase in the radius of the universe by a factor of 2202 from then to now, we can calculate the current radius of the universe. Thus, 14.61 million light years multiplied by 2202 is 32.18 billion light years. This seems to be a reasonable approximation to the current accepted size of the observable cosmos, namely 46.5 billion light years.
Under these circumstances, four problems seem to have been solved. First, the horizon problem has basically disappeared. Second, the necessity for inflationary expansion and its attendant difficulties has been removed. Third, this approach suggests that the reason why there is no evidence of the influence of gravitational waves on the CMB is that the major expansion episode occurred after the CMB had formed, not before. This would be in line with bible indications. Then fourth, the problem no longer exists that some scholars have had in trying to get light back from the distant parts of the universe within a shorter time-frame than consensus science has proposed.
TO BE CONTINUED IN FRAGMENTS NO. 5
Barry Setterfield, 31st January 2023
FRAGMENTS NO 5 - follows on from Fragments No.4
Cosmic Expansion, the ZPE, and JWST images:
However, other problems exist. The images from the James Webb Space Telescope point to some old and some emerging problems in astronomy which are proving difficult to deal with. The new data discussed above at least hold the potential to resolve some of these issues. Images from the JWST such as in Figure 18 are indeed awe-inspiring. However, they show a great multitude of fully mature, ultra-brilliant galaxies in the vastness of the universe, and very close to the inception of the cosmos, or, colloquially, the moment of the Big Bang (BB).

Figure 18: Galaxies near the origin of the cosmos from JWST
The actual data are impressive. So far, the greatest redshift JSWT has recorded is given as z = 16.7 which translates into 235 million years after the BB. Up until recently, BB theory suggested that the earliest galaxies could possibly appear would be about 1 billion years after the BB. In contrast to the BB model, which predicts only a very few disorganized galaxies coming together as fragments at the beginning, the JWST revealed that fully mature, massive galaxies become more numerous, not less, as the moment of the BB is neared. At a redshift of z = 5, galaxies are 10 times more numerous than theory predicted [A]. At redshifts greater than z = 10, galaxies are 100,000 times more numerous than expected [A]. The measurements also suggest that they may be up to 600 times more brilliant than galaxies in our immediate area [B]. Furthermore, the JWST data shows that stars within those galaxies show an equivalent of 1 billion years of burning, yet they are not even 500 million years from the BB [C]. “No one was expecting anything like this,” says Michael Boylan-Kolchin of the University of Texas, Austin [D]. “Galaxies are exploding out of the woodwork,” says Rachel Somerville of the Flatiron Institute [D]. “This is way outside the box of what models were predicting,” says Garth Illingworth of the University of California (UC), Santa Cruz [D]. All the new data flies in the face of BB theory which has been built up over the last 75 years and taught that way publicly by the BB theorists. These theorists are facing a crisis. “Right now, I find myself lying awake at three in the morning,” says Alison Kirkpatrick, an astronomer at the University of Kansas in Lawrence, “and wondering if everything I’ve done is wrong”[E].
[A] A very early onset of massive galaxy formation, Ivo Labbe et al., https://arxiv.org/abs/2207.12446 Accepted by Nature Journal. [B] Early results from GLASS-JWST III: Galaxy candidates from z =9 to z= 15, Marco Castellano et al. https://arxiv.org/abs/2207.09436 [C] https://interestingengineering.com/science/james-webb-telescope-will-reveal-dawn-of-cosmos [D] https://www.science.org/content/article/webb-telescope-reveals-unpredicted-bounty-bright-galaxies-early-universe [E] Alison Kirkpatrick, Astronomer, Uni. of Kansas in Lawrence, https://twitter.com/AkAstronomy/status/1552350497729904640
The Problem of Time
One key part of the problem that arises from these JWST images is one that has been stalking astronomers for some time, and is now coming to a head. The problem is basically the formation time of astronomical objects on the standard gravitational model. The problem is detailed in “The Dark Side of the Universe,” Chapter 4, by James Trefil. The JWST images have made the problem much worse. They have shown fully formed galaxies with mature stars so close to the inception of the cosmos that it is nearly impossible to form by gravity. The reason is that gravity takes a long time to act to produce galaxies, stars and planets from clouds of gas and dust. Furthermore, the formation of elements and their distribution throughout a galaxy is dependent on several generations of “cooking” by nuclear processes inside stars which explode the elements out at the end of their life. This takes a significant time on consensus theory, yet the JWST results show that heavy elements are there in the earliest galaxies. An alternate view in keeping with these JWST data comes from a recent development in which plasma astronomy played a part. See our YouTube session here: https://www.youtube.com/watch?v=DkH0YprMKnY
Nevertheless. the time problem has been shown to be significantly reduced by the plasma approach to astronomy, and even more so when assisted by a low strength for the ZPE. This became apparent from the plasma experiments of Dr. Anthony Peratt at Los Alamos National Labs. As mentioned earlier, the overall structure of the universe is made up of plasma filaments with voids in between. When the location of known galaxies in the relatively nearby cosmos is plotted, the result is the filaments and voids as shown in Figure 19 on the left.. Every dot is the position of a galaxy. Our Milky Way is central in the left image, and in the right hand image, from the EU’s Tartu Observatory, it is in the bottom left corner. This right-hand image goes out much farther into the cosmos.
Figure 19: Every dot is the plotted position of a known galaxy. Left – nearby & Right - distant cosmos.
An Answer to the Problem: Plasma Astronomy
Dr Peratt experimented with plasma filaments in the lab and recorded the results of their interaction in the IEEE Transactions on Plasma Science, Vol. PS-14 Nos. 6 (Part 1, pp. 639-660) & 7 (Part 2, pp. 763-778). His updated conclusions were published in “Physics of the Plasma Universe,” (Springer 2015). He documented, using high-speed cameras, how two or more interacting filaments in the lab could form miniature galaxies. These galaxies had characteristics on a diminutive scale which corresponded with all known types of galaxies in the large-scale universe. Figure 20 gives a typical sequence at what happens at the point of interaction of two plasma filaments. We are looking down the long axis of the two filaments with parallel currents. This causes the filaments to attract each other via magnetic interaction and can form miniature galaxies of all morphologies and all variations in the numbers of spiral arms, depending on the initial conditions.


Figure 20: One of Peratt’s experiments showing how a spiral galaxy can form in the lab from two filaments from their electric & magnetic interaction.
On the extreme right is an image of M1300 in Eridanus of exactly this type of galaxy. Note that all types of galaxies were formed by this process.
The high-speed cameras that Peratt was using, allowed accurate timing and imaging of the sequence of events that took place to form these miniature galaxies. Peratt defines what he refers to as a “time-step,” T, in miniature galaxy formation, where T = 0.000104 seconds (that is 1.04 x 10^-4 seconds). A full spiral galaxy was formed in 2500 – 5000 time-steps, or about ¼ to ½ second. He then noted that to upscale these lab results to actual astronomical phenomena in real time, the value of T had to be multiplied by a factor of 5.87 x 10^11 to give the answer in seconds. This factor was determined by comparing the physical parameters of what he was seeing in the lab with what was happening with objects in space and was detailed on pages 645 - 646 ff. of the IEEE article.
The sequence of events in the lab was important as it paralleled what was happening with actual galaxies. From the experiments with plasma filaments, it was found that the first step in the process was the time it took for two or more filaments to come close enough by electromagnetic attraction to begin their interaction sequence. This “traversal time,” as Peratt calls it on page 646 of the IEEE article, took about 300 time-steps, so T = 300. This traversal-time has to be added to the interaction time needed to form the various parts of the growing galaxies.
The first major interaction event in the formation of miniature galaxies was the equivalent of quasars starting to form in the developing cores near T = 360 [IEE p. 650]. As the interaction went on, the complete cores of the miniature galaxies had fully formed, along with their “old” or Population II stars, by a time-step of T = 600 [Book, 1st edition, p.120]. The miniature spiral arms then started developing out of the core and were extending, along with the formation of their “young” or Population I stars, by a time-step of T = 2500 [Peratt’s Book, p.120 etc]. In plasma physics, stars form when a plasma filament undergoes a Bennett or Z-pinch and forms a plasma ball. In the lab, these pinch processes only take 40 to 200 nanoseconds to complete [see Peratt’s Book, 1st edition, p.117 – 118].
The ZPE Plus Plasma Physics Gives a Surprising Answer:
As a result of these lab data, the serious time problem that gravitational astronomy has with galaxy and star formation is potentially overcome. For example, Peratt’s figures show that a full galaxy can form by plasma processes in something like 50 million years, instead of 1 billion. However, there is more to consider since plasma interactions are electric and magnetic in character and the electromagnetic properties of the vacuum are governed by the strength of the ZPE. Thus, it can be demonstrated that electric and magnetic interactions were faster when the ZPE strength was lower, in inverse proportion [See NPA Monograph No.1, 2013, “Cosmology and the Zero Point Energy”]. Therefore, since we have shown above that the ZPE strength has increased by a factor of about 11 billion from the time of CMB formation to now, then it follows that the plasma interactions were about 11 billion times faster than now at the time the CMB was formed.
Let us now take Peratt’s time-codes, T, for the development of galaxies in the lab by electro-magnetic interactions and add to that the traversal time of T = 300 to give a total time code T*. We then upscale T* to actual astronomical phenomena in real time by multiplying by Peratt’s factor of 5.87 x 10^11 to give the answer in seconds. Then we divide by the plasma interaction factor which made these processes faster due to the ZPE change, namely 11 billion (that is 11 x 10^9) to give the actual time in seconds which it took to form these objects in the early universe. When we do this the following timing emerges:
1. Quasars start forming in developing galaxy cores at (T = 300) + (T = 360). This gives T* = 660.
Thus, (660) x (5.87 x 10^11) / (11 x 10^9) = 35220 seconds or about 10 hours.
2. Galaxy Cores & their Pop. II stars were well-developed by (T = 300) + (T = 600) gives T* = 900.
Thus, (900) x (5.87 x 10^11) / (11 x 10^9) = 48027 seconds or about 13.5 hours.
3. Galaxy spiral arms extending & first Pop. I stars forming (T = 300) + (T = 2500) gives T* = 2800
Thus, (2800) x (5,87 x 10^11) / (11 x 10^9) = 149418 seconds, roughly 45 hours or 2 days.
Let us now summarize what we have learnt from this accumulation of data.
Summary of Results
- Matter, comprising electrons, protons, & possibly quarks, was in the plasma state at the beginning. Plasma has no form and is vacuous, unlike atoms and planets which do have a form. Genesis 1:2 says that “matter” (ERETZ in Hebrew, which at its most basic means “that which is firm”), had no form and was vacuous. This seems to imply plasma
- Plasma processes (as shown here: https://www.youtube.com/watch?v=DkH0YprMKnY ) demonstrate that all the elements in their known abundances formed in a few minutes. In addition to hydrogen, recent evidence is that the sub-atomic constituents of oxygen were also present in large amounts, making it a water plasma in line with Genesis 1:2.
- The evidence from the Cosmic Microwave Background (CMB) is that the cosmos was being expanded out. The Bible says 12 times, as in Isaiah 42:5, 44:24, 51:13 etc that God did the stretching. Currently science is at a loss to find a cause for this phenomenon. The stretching did two things. First it cooled the originally very high temperature and second, the stretching imparted energy to the fabric of space in the same way that inflating a balloon put energy into its fabric. This energy appears as the Zero Point Energy (ZPE). As this built up and the temperature cooled, conditions were right for neutral atoms to form out of the plasma. This event cleared the plasma fog and allowed light and radiation to stream out – the first light since the creation event. The Bible says in Genesis 1:2 that this eruption of light from the plasma occurred 12 hours after the initial creation event. This eruption of light from the plasma fog has left its imprint as the Cosmic Microwave Background (CMB) radiation.
- The CMB data show that sound waves at 110 decibels had compressed and rarefied the plasma into filaments and voids like the air in a flute being played. Sound in the early plasma was transmitted at 57% the speed of light then, which was 11 billion times faster than now. So, by the time the CMB originated, plasma throughout the whole cosmos had been formed into filaments, sheets and voids by the sound waves. Analysis of the CMB has shown that there were basically three notes sounding with intervals the same as those of A, F sharp and C sharp – in other words, an F sharp minor chord. One scientist said “We can hear the music of Creation.” Hebrews 11:3 says that “the worlds were framed by the word of God, so the things that are seen were not made by things that are visible.” Psalm 33:9 says “God spoke and it was made; He commanded, & it was established.”
- Science was expecting to see the evidence of an extremely rapid inflationary expansion of the cosmos on the CMB. It has been sought for a long time and not been found. The Bible says that rapid expansion occurred on Day 2 of creation week after the CMB had formed with light bursting out, not before as science had proposed (Genesis 1:6 – the word translated “firmament” means ‘something that has been stretched out.’)
- The data from the CMB temperature indicates that this stretching continued well beyond Creation Week. This expansion put energy into the fabric of space, namely the ZPE. The stretching went on, as indicated by the CMB temperature data, and so the ZPE built up. In 1987 it was discovered that the ZPE was responsible for maintaining atomic structures throughout the universe. One scientist said that “without the ZPE, every atom in the universe would undergo instantaneous collapse.” In Colossians 1:17 and Hebrews 1:3, we are told that all things hold together by the word of the Lord’s power. Since God stretched out the heavens which produced the ZPE which supports all atomic structures, then modern science, unwittingly, has proven the Bible to be correct. Science is still at a loss to know what caused cosmic expansion which resulted in the ZPE and atomic stability. The Bible says God did it.
- The CMB temperature data show how much the radius and hence volume of the cosmos has increased by expansion. This also gives us a measure of how much the ZPE has increased since the CMB was formed. From these data we know the strength of the ZPE has increased by a factor of about 11 billion since then. This is backed up by a second, independent line of evidence. It is important to remember that the ZPE controls the electric and magnetic properties of the vacuum. Further, it has been shown that as the ZPE increased, the electric and magnetic effects decreased in inverse proportion. Since the speed of light is one electromagnetic effect which is directly involved in this, it follows that lightspeed originally was about 11 billion times the speed of light now. One outcome is that light from the most distant parts of the universe arrived at earth after a few thousand years, not a few million or billion.
- Since the electromagnetic effects of a lower ZPE mean that plasma interactions, being electric and magnetic in origin, were also affected and proceeded significantly faster than they do now. The lab data of Anthony Peratt at LANL show how fast galaxies and stars can form by plasma interactions today compared with the gravitational model. When the ZPE correction is applied to plasma data, an amazing circumstance emerges as shown by the following Table 2.
TABLE 2: FORMATION TIMES COMPARISON USING ORIGINAL ZPE VALUE. Plasma lab formation times were upscaled to cosmic proportions using the conversion 5.87 x 10^11 seconds determined from data by Peratt. The ZPE conversion factor from data is 11 x 10^9.
Event |
Gravitationally |
Plasma universe |
Plasma & ZPE |
Bible Reference |
Elements formed |
3 billion years |
½ hour to 1 hour |
Water plasma in minutes. |
Genesis 1:2 |
CMBR formed as light erupted |
300,000 years after origin (AO) |
undefined |
Nearly 12 hours |
Genesis 1:3
‘light’ singular |
Period of rapid expansion of universe |
Very soon after origin (AO) – data expected on CMB but none found. |
Undefined – depends on model |
Soon after CMB formed, not before.
See Figure 22 |
Genesis 1:6
“firmament” = ‘something stretched out’
Isaiah 51:13 etc. |
Quasars develop in Galaxy Cores |
750 million to
1 billion years
After Origin (AO) |
12.3 million years After Origin (AO) |
Developing in 10 hours & shining by ½ Day AO. |
Genesis 1:4b
‘lights’ plural &
‘darknesses’ plural – LXX. |
Galaxy cores complete with oldest stars** (Pop. II) shining |
1 – 2 billion years After Origin. |
16.7 million years AO |
13.5 hours AO |
The “morning stars” from the 1st Day – Job 38:7 LXX |
Galaxy spiral arms extending & 1st “young stars” (Pop. 1)* forming in them. |
5 – 8 billion years After Origin |
52 million years After Origin |
2 days AO and onwards to galaxy completion. |
Spiral arm stars “Give light on the earth” & sun
Lights up Day 4. Genesis 1:15-19 |
Galaxy formation time generally |
1 to 1.6 billion years (minimum) |
50 - 100 million years |
2 - 4 days. |
Genesis 1 – the cosmos formed in 6 days |
Star formation generally single) |
10 to 50 million years. |
5.5 million years |
4.5 hours |
|
*Young stars (like our Sun) are spiral arm stars and called Population I stars. The oldest stars are **Population II, mainly in galaxy cores – the Morning Stars in Job 38:7 – see Figure 21.
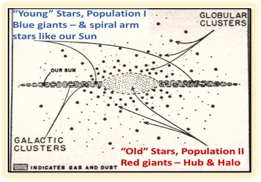

Figure 21: Left - The position of the “old” or Population II stars in the cores or hubs of spiral galaxies and the “young” or Population I stars in the spiral arms like our Sun. Prominent Population II stars are red giants; prominent Population I stars are blue giants. That is why many spiral galaxies have yellow or red cores and blue spiral arms as in the image of the Andromeda galaxy M42 on the right.
Figure 22: Time line of cosmic expansion and related events.
FRAGMENTS 5A
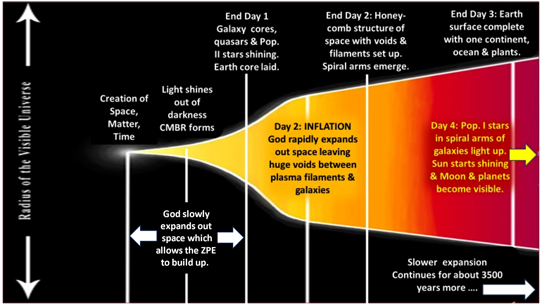
Figure 22: Time line of cosmic expansion and related events.
Added 02/04/23.
Fragments 5 Update
Cosmic Expansion, the ZPE, and JWST images
However, other problems exist. The images from the James Webb Space Telescope point to some old and some emerging problems in astronomy which are proving difficult to deal with. The new data discussed above at least hold the potential to resolve some of these issues. Images from the JWST such as in Figure 18 are indeed awe-inspiring. However, they show a great multitude of fully mature, ultra-brilliant galaxies in the vastness of the universe, and very close to the inception of the cosmos, or, colloquially, the moment of the Big Bang (BB).
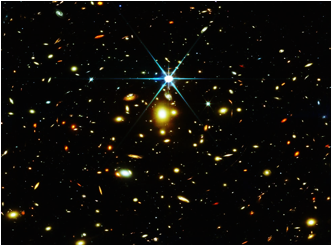
Figure 18: Galaxies near the origin of the cosmos from JWST
The actual data are impressive. So far, the greatest redshift JSWT has recorded is given as z = 16.7 which translates into 235 million years after the BB. Up until recently, BB theory suggested that the earliest galaxies could possibly appear would be about 1 billion years after the BB. In contrast to the BB model, which predicts only a very few disorganized galaxies coming together as fragments at the beginning, the JWST revealed that fully mature, massive galaxies become more numerous, not less, as the moment of the BB is neared. At a redshift of z = 5, galaxies are 10 times more numerous than theory predicted [A]. At redshifts greater than z = 10, galaxies are 100,000 times more numerous than expected [A]. The measurements also suggest that they may be up to 600 times more brilliant than galaxies in our immediate area [B]. Furthermore, the JWST data shows that stars within those galaxies show an equivalent of 1 billion years of burning, yet they are not even 500 million years from the BB [C]. “No one was expecting anything like this,” says Michael Boylan-Kolchin of the University of Texas, Austin [D]. “Galaxies are exploding out of the woodwork,” says Rachel Somerville of the Flatiron Institute [D]. “This is way outside the box of what models were predicting,” says Garth Illingworth of the University of California (UC), Santa Cruz [D]. All the new data flies in the face of BB theory which has been built up over the last 75 years and taught that way publicly by the BB theorists.
These theorists are facing a crisis. “Right now, I find myself lying awake at three in the morning,” says Alison Kirkpatrick, an astronomer at the University of Kansas in Lawrence, “and wondering if everything I’ve done is wrong”[E]. [A] A very early onset of massive galaxy formation, Ivo Labbe et al., https://arxiv.org/abs/2207.12446 Accepted by Nature Journal. [B] Early results from GLASS-JWST III: Galaxy candidates from z =9 to z= 15, Marco Castellano et al. https://arxiv.org/abs/2207.09436 [C] https://interestingengineering.com/science/james-webb-telescope-will-reveal-dawn-of-cosmos [D] https://www.science.org/content/article/webb-telescope-reveals-unpredicted-bounty-bright-galaxies-early-universe [E] Alison Kirkpatrick, Astronomer, Uni. of Kansas in Lawrence, https://twitter.com/AkAstronomy/status/1552350497729904640
The Problem of Time
One key part of the problem that arises from these JWST images is one that has been stalking astronomers for some time, and is now coming to a head. The problem is basically the formation time of astronomical objects on the standard gravitational model. The problem is detailed in “The Dark Side of the Universe,” Chapter 4, by James Trefil. The JWST images have made the problem much worse. They have shown fully formed galaxies with mature stars so close to the inception of the cosmos that it is nearly impossible to form by gravity. The reason is that gravity takes a long time to act to produce galaxies, stars and planets from clouds of gas and dust. Furthermore, the formation of elements and their distribution throughout a galaxy is dependent on several generations of “cooking” by nuclear processes inside stars which explode the elements out at the end of their life. This takes a significant time on consensus theory, yet the JWST results show that heavy elements are there in the earliest galaxies. An alternate view in keeping with these JWST data comes from a recent development in which plasma astronomy played a part. See our YouTube session here: https://www.youtube.com/watch?v=DkH0YprMKnY
Nevertheless. the time problem has been shown to be significantly reduced by the plasma approach to astronomy, and even more so when assisted by a low strength for the ZPE. This became apparent from the plasma experiments of Dr. Anthony Peratt at Los Alamos National Labs. As mentioned earlier, the overall structure of the universe is made up of plasma filaments with voids in between. When the location of known galaxies in the relatively nearby cosmos is plotted, the result is the filaments and voids as shown in Figure 19 on the left.. Every dot is the position of a galaxy. Our Milky Way is central in the left image, and in the right hand image, from the EU’s Tartu Observatory, it is in the bottom left corner. This right-hand image goes out much farther into the cosmos.
Figure 19: Every dot is the plotted position of a known galaxy. Left – nearby & Right - distant cosmos.
An Answer to the Problem: Plasma Astronomy
Dr Peratt experimented with plasma filaments in the lab and recorded the results of their interaction in the IEEE Transactions on Plasma Science, Vol. PS-14 Nos. 6 (Part 1, pp. 639-660) & 7 (Part 2, pp. 763-778). His updated conclusions were published in “Physics of the Plasma Universe,” (Springer 2015). He documented, using high-speed cameras, how two or more interacting filaments in the lab could form miniature galaxies. These galaxies had characteristics on a diminutive scale which corresponded with all known types of galaxies in the large-scale universe. Figure 20 gives a typical sequence at what happens at the point of interaction of two plasma filaments. We are looking down the long axis of the two filaments with parallel currents. This causes the filaments to attract each other via magnetic interaction and can form miniature galaxies of all morphologies and all variations in the numbers of spiral arms, depending on the initial conditions.
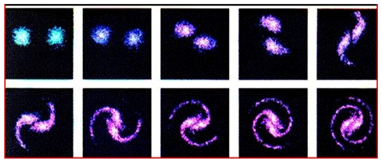
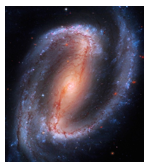
Figure 20: One of Peratt’s experiments showing how a spiral galaxy
can form in the lab from two filaments from their electric & magnetic interaction.
On the extreme right is an image of M1300 in Eridanus of exactly this type of galaxy.
Note that all types of galaxies were formed by this process.
The high-speed cameras that Peratt was using, allowed accurate timing and imaging of the sequence of events that took place to form these miniature galaxies. Peratt defines what he refers to as a “time-step,” T, in miniature galaxy formation, where T = 0.000104 seconds (that is 1.04 x 10^-4 seconds). A full spiral galaxy was formed in 2500 – 5000 time-steps, or about ¼ to ½ second. He then noted that to upscale these lab results to actual astronomical phenomena in real time, the value of T had to be multiplied by a factor of 5.87 x 10^11 to give the answer in seconds. This factor was determined by comparing the physical parameters of what he was seeing in the lab with what was happening with objects in space and was detailed on pages 645 - 646 ff. of the IEEE article.
The sequence of events in the lab was important as it paralleled what was happening with actual galaxies. From the experiments with plasma filaments, it was found that the first step in the process was the time it took for two or more filaments to come close enough by electromagnetic attraction to begin their interaction sequence. This “traversal time,” as Peratt calls it on page 646 of the IEEE article, took about 300 time-steps, so T = 300. This traversal-time has to be added to the interaction time needed to form the various parts of the growing galaxies.
The first major interaction event in the formation of miniature galaxies was the equivalent of quasars starting to form in the developing cores near T = 360 [IEE p. 650]. As the interaction went on, the complete cores of the miniature galaxies had fully formed, along with their “old” or Population II stars, by a time-step of T = 600 [Book, 1st edition, p.120]. The miniature spiral arms then started developing out of the core and were extending, along with the formation of the first “young” or Population I stars, by a time-step of T = 2500 [Peratt’s Book, p.120 etc]. In plasma physics, stars form when a plasma filament undergoes a Bennett or Z-pinch and forms a plasma ball. In the lab, these pinch processes only take 40 to 200 nanoseconds to complete [see Peratt’s Book, 1st edition, p.117 – 118].
The ZPE Plus Plasma Physics Gives a Surprising Answer:
As a result of these lab data, the serious time problem that gravitational astronomy has with galaxy and star formation is potentially overcome. For example, Peratt’s figures show that a full galaxy can form by plasma processes in something like 50 million years, instead of 1 billion. However, there is more to consider since plasma interactions are electric and magnetic in character and the electromagnetic properties of the vacuum are governed by the strength of the ZPE. Thus, it can be demonstrated that electric and magnetic interactions were faster when the ZPE strength was lower, in inverse proportion [See NPA Monograph No.1, 2013, “Cosmology and the Zero Point Energy”]. Therefore, since we have shown above that the ZPE strength has increased by a factor of about 11 billion from the time of CMB formation to now, then it follows that the plasma interactions were about 11 billion times faster than now at the time the CMB was formed.
Let us now take Peratt’s time-codes, T, for the development of galaxies in the lab by electro-magnetic interactions and add to that the traversal time of T = 300 to give a total time code T*. We then upscale T* to actual astronomical phenomena in real time by multiplying by Peratt’s factor of 5.87 x 10^11 to give the answer in seconds. Then we divide by the plasma interaction factor which made these processes faster due to the ZPE change, namely 11 billion (that is 11 x 10^9) to give the actual time in seconds which it took to form these objects in the early universe. When we do this the following timing emerges:
1. Quasars start forming in developing galaxy cores at (T = 300) + (T = 360). This gives T* = 660.
Thus, (660) x (5.87 x 10^11) / (11 x 10^9) = 35220 seconds or about 10 hours.
2. Galaxy Cores & their Pop. II stars were well-developed by (T = 300) + (T = 600) gives T* = 900.
Thus, (900) x (5.87 x 10^11) / (11 x 10^9) = 48027 seconds or about 13.5 hours.
3. Galaxy spiral arms extending & first Pop. I stars forming (T = 300) + (T = 2500) gives T* = 2800
Thus, (2800) x (5,87 x 10^11) / (11 x 10^9) = 149418 seconds, roughly 45 hours or 2 days.
Let us now summarize what we have learnt from this accumulation of data.
Summary of Results
- Matter, comprising electrons, protons, & possibly quarks, was in the plasma state at the beginning. Plasma has no form and is vacuous, unlike atoms and planets which do have a form. Genesis 1:2 says that “matter” (ERETZ in Hebrew, which at its most basic means “that which is firm”), had no form and was vacuous. This seems to imply plasma
- Plasma processes (as shown here: https://www.youtube.com/watch?v=DkH0YprMKnY ) demonstrate that all the elements in their known abundances formed in a few minutes. In addition to hydrogen, recent evidence is that the sub-atomic constituents of oxygen were also present in large amounts, making it a water plasma in line with Genesis 1:2.
- The evidence from the Cosmic Microwave Background (CMB) is that the cosmos was being expanded out. The Bible says 12 times, as in Isaiah 42:5, 44:24, 51:13 etc that God did the stretching. Currently science is at a loss to find a cause for this phenomenon. The stretching did two things. First it cooled the originally very high temperature and second, the stretching imparted energy to the fabric of space in the same way that inflating a balloon put energy into its fabric. This energy appears as the Zero Point Energy (ZPE). As this built up and the temperature cooled, conditions were right for neutral atoms to form out of the plasma. This event cleared the plasma fog and allowed light and radiation to stream out – the first light since the creation event. The Bible says in Genesis 1:2 that this eruption of light from the plasma occurred 12 hours after the initial creation event. This eruption of light from the plasma fog has left its imprint as the Cosmic Microwave Background (CMB) radiation.
- The CMB data show that sound waves at 110 decibels had compressed and rarefied the plasma into filaments and voids like the air in a flute being played. Sound in the early plasma was transmitted at 57% the speed of light then, which was 11 billion times faster than now. So, by the time the CMB originated, plasma throughout the whole cosmos had been formed into filaments, sheets and voids by the sound waves. Analysis of the CMB has shown that there were basically three notes sounding with intervals the same as those of A, F sharp and C sharp – in other words, an F sharp minor chord. One scientist said “We can hear the music of Creation.” Hebrews 11:3 says that “the worlds were framed by the word of God, so the things that are seen were not made by things that are visible.” Psalm 33:9 says “God spoke and it was made; He commanded, & it was established.”
- Science was expecting to see the evidence of an extremely rapid inflationary expansion of the cosmos on the CMB. It has been sought for a long time and not been found. The Bible says that rapid expansion occurred on Day 2 of creation week after the CMB had formed with light bursting out, not before as science had proposed (Genesis 1:6 – the word translated “firmament” means ‘something that has been stretched out.’)
- The data from the CMB temperature indicates that this stretching continued well beyond Creation Week. This expansion put energy into the fabric of space, namely the ZPE. The stretching went on, as indicated by the CMB temperature data, and so the ZPE built up. In 1987 it was discovered that the ZPE was responsible for maintaining atomic structures throughout the universe. One scientist said that “without the ZPE, every atom in the universe would undergo instantaneous collapse.” In Colossians 1:17 and Hebrews 1:3, we are told that all things hold together by the word of the Lord’s power. Since God stretched out the heavens which produced the ZPE which supports all atomic structures, then modern science, unwittingly, has proven the Bible to be correct. Science is still at a loss to know what caused cosmic expansion which resulted in the ZPE and atomic stability. The Bible says God did it.
- The CMB temperature data show how much the radius and hence volume of the cosmos has increased by expansion. This also gives us a measure of how much the ZPE has increased since the CMB was formed. From these data we know the strength of the ZPE has increased by a factor of about 11 billion since then. This is backed up by a second, independent line of evidence. It is important to remember that the ZPE controls the electric and magnetic properties of the vacuum. Further, it has been shown that as the ZPE increased, the electric and magnetic effects decreased in inverse proportion. Since the speed of light is one electromagnetic effect which is directly involved in this, it follows that lightspeed originally was about 11 billion times the speed of light now. One outcome is that light from the most distant parts of the universe arrived at earth after a few thousand years, not a few million or billion.
- Since the electromagnetic effects of a lower ZPE mean that plasma interactions, being electric and magnetic in origin, were also affected and proceeded significantly faster than they do now. The lab data of Anthony Peratt at LANL show how fast galaxies and stars can form by plasma interactions today compared with the gravitational model. When the ZPE correction is applied to plasma data, an amazing circumstance emerges as shown by the following Table 2.
TABLE 2: FORMATION TIMES COMPARISON USING ORIGINAL ZPE VALUE.
Plasma lab formation times were upscaled to cosmic proportions using the conversion 5.87 x 10^11 seconds determined from data by Peratt.
The ZPE conversion factor from data is 11 x 10^9.
Event |
Gravitationally |
Plasma universe |
Plasma & ZPE |
Bible Reference |
Elements formed |
3 billion years |
½ hour to 1 hour |
Water plasma in minutes. |
Genesis 1:2 |
CMBR formed as light erupted |
300,000 years after origin (AO) |
undefined |
Nearly 12 hours |
Genesis 1:3
‘light’ singular |
Period of rapid expansion of universe |
Very soon after origin (AO) – data expected on CMB but none found. |
Undefined – depends on model |
Soon after CMB formed, not before.
See Figure 22 |
Genesis 1:6
“firmament” = ‘something stretched out’
Isaiah 51:13 etc. |
Quasars develop in Galaxy Cores |
750 million to
1 billion years
After Origin (AO) |
12.3 million years After Origin (AO) |
Developing in 10 hours & shining by ½ Day AO. |
Genesis 1:4b
‘lights’ plural &
‘darknesses’ plural – LXX. |
Galaxy cores complete with oldest stars** (Pop. II) shining |
1 – 2 billion years After Origin. |
16.7 million years AO |
13.5 hours AO |
The “morning stars” from the 1st Day – Job 38:7 LXX |
Galaxy spiral arms extending & 1st “young stars” (Pop. 1)* forming in them. |
5 – 8 billion years After Origin |
52 million years After Origin |
2 days AO and onwards to galaxy completion. |
Spiral arm stars “Give light on the earth” & sun lights up Day 4. Genesis 1:15-19 |
Galaxy formation time generally |
1 to 1.6 billion years (minimum) |
50 - 100 million years |
2 - 4 days. |
Genesis 1 – the cosmos formed in 6 days |
Star formation |
10 to 50 million years. |
71.5 days |
5.61 x 10^- 4 seconds |
See Note below |
*Young stars (like our Sun) are spiral arm stars and called Population I stars. The oldest stars are **Population II, mainly in galaxy cores – the Morning Stars in Job 38:7 – see Figure 21. Note: Plasma lab formation times for stars on filaments by the Z-pinch process is 40 to 200 nanoseconds. The scaling factor in this case is different as stars form on filaments about 0.25 light years across, not on galaxy sized filaments. The conversion factor is then 3.087 x 10^13 seconds. This gives stars by plasma processes in 71.5 days. At the beginning of the cosmos with the 11 x 10^9 factor for the ZPE, this becomes 5.61 x 10^-4 seconds to form a plasma ball. The pinch focusses the filament current on the ball, which lights up like an arc welders torch.

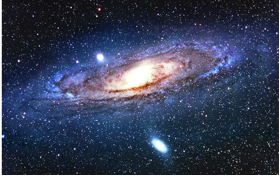
Figure 21: Left - The position of the “old” or Population II stars in the cores or hubs of spiral galaxies
and the “young” or Population I stars in the spiral arms like our Sun.
Prominent Population II stars are red giants; prominent Population I stars are blue giants.
That is why many spiral galaxies have yellow or red cores and blue spiral arms
as in the image of the Andromeda galaxy M42 on the right.
Barry Setterfield, 7th February, 2023

Comments by Lambert 2/2/23:
Barry et al.,
I can’t seem to find any resonances between the latest secular model for the early universe as Barry describes in his “Fragments” —-and Genesis I One.
I believe God reveals profound truth with simple images that even a child can understand.
Most all astronomers these days are not God-fearers but “natural man.”
Hence:
“…we speak the wisdom of God in a mystery, the hidden wisdom which God ordained before the ages for our glory,
8 which none of the rulers of this age knew; for had they known, they would not have crucified the Lord of glory.
9 But as it is written:
“Eye has not seen, nor ear heard,
Nor have entered into the heart of man
The things which God has prepared for those who love Him.”
10 But God has revealed them to us through His Spirit. For the Spirit searches all things, yes, the deep things of God.
11 For what man knows the things of a man except the spirit of the man which is in him? Even so no one knows the things of God except the Spirit of God. 12 Now we have received, not the spirit of the world, but the Spirit who is from God, that we might know the things that have been freely given to us by God. 13 These things we also speak, not in words which man’s wisdom teaches but which the Holy Spirit teaches, comparing spiritual things with spiritual.
14 But the natural man does not receive the things of the Spirit of God, for they are foolishness to him; nor can he know them, because they are spiritually discerned.
15 But he who is spiritual judges all things, yet he himself is rightly judged by no one.
16 For “who has known the mind of the LORD that he may instruct Him?” But we have the mind of Christ.” (1 Corinthians 2)
Today’s scientists are, more often than not, enemies of God. Why should He favor them? Instead I would expect them to all look like fools on the last day. There is a simplicity in Christ that sets aside human arrogance and self-righteousness.
We CAN surely critique secular wisdom because we have been enabled to recognize truth and refute error, like children;
“By this you know the Spirit of God: Every spirit that confesses that Jesus Christ has come in the flesh is of God,
3 and every spirit that does not confess that Jesus Christ has come in the flesh is not of God. And this is the spirit of the Antichrist, which you have heard was coming, and is now already in the world.
4 You are of God, little children, and have overcome them, because He who is in you is greater than he who is in the world.
5 They are of the world. Therefore they speak as of the world, and the world hears them.
6 We are of God. He who knows God hears us; he who is not of God does not hear us. By this we know the spirit of truth and the spirit of error.“ (1 John 4)
Lambert
From S. Doug Woodward:
CERTAINLY TRUE. The role of the apologist has to suffer the slings and arrows of the unbeliever, unfortunately. But as you say, we have eyes that discern wisdom that the unbeliever does not know.

Lambert Dolphin
Email is welcome
Lambert Dolphin's Place
Recent and Recovered Articles
Newsletters Old and New
March 2, 2022. January 25, 2023. February 1, 2023. February 4, 2023. February 7, 2023. July 23, 2023. November 24, 2023